 ReliCheck MM Studio · Plain-English Teaching Guide
Guide 01 · Introduction and Data Prep
ReliCheck MM Studio · Plain-English Teaching Guide
Guide 01 · Introduction and Data Prep
 Mixed Methods · Teaching Guide 01 of 03
Introduction and Data Prep
The puzzle, the design, and the dataset, before a single analysis runs
A three-part guide to a full convergent mixed methods study in MM Studio. This is Part 1.
Each lesson covers one decision, not one menu click. The first question is always: what problem does this step solve? The second question is: what would go wrong if you skipped it? Screenshots show what MM Studio looks like at that moment, but the lesson is about the reasoning, not the route.
The study runs the whole three-part series. Two clinics offer the same diabetes coaching program. One clinic’s patients gain measurable confidence and improve their A1C more often. Before you can ask why, you have to build a dataset that makes the comparison honest. That is what Part 1 covers.
Fifty patients, two clinics, one open-ended question per patient, and thirteen columns that need to be classified before any analysis runs. The Data Map and Data Quality checks are the work of Part 1. Everything in Parts 2 and 3 depends on getting them right here.
What the clinics show, and why it matters before the data opens
Two clinics run the same regional diabetes coaching program: same curriculum, same check-in schedule, same coaching model. Over two years, Northside patients leave talking about their routines differently than Lakeview patients do: more confident, more specific about what they do when blood sugar drifts.
At the same time, the clinical numbers tell a similar story. A1C improvement rates track higher at Northside. But Lakeview patients show up. They attend sessions. They fill out every form. On paper, they are engaged. So why do outcomes differ?
The first wrong move is to blame Lakeview. The numbers say outcomes differ; they do not say why.
A simple outcome comparison (Northside improved more) is easy to read as a performance gap. From there it is a short step to “Lakeview patients were less motivated” or “the coaches there were less effective.” Both conclusions can come from the numbers alone, and both can be wrong. The pattern that Lakeview patients attended but did not improve as often suggests there may be a structural story rather than a motivation or effort story.
A study that does not ask patients what was happening while they attended cannot distinguish between those two explanations. That is the reason for the open-ended question in the survey.
Do self-efficacy and clinical outcomes differ between Northside and Lakeview patients – and if so, what do patients say was happening during the program that might explain the gap?
Every analysis decision in the next two guides flows from this question. Which comparison test. Which variables to include. Which themes to look for in the open responses. Starting with a clear puzzle is not a formality – it is what keeps the analysis from becoming a tour of available statistics.
What convergent means – and why design is a decision, not a label
Mixed methods studies come in several designs. The one chosen here is called convergent parallel. The name describes the structure: both strands – quantitative and qualitative – are collected at the same time (parallel), and then brought together to see where they agree, where one explains the other, and where they complicate each other (convergent).
The three things strands can do when they meet
In this study, the design is convergent because the goal is to put that clinical puzzle to an integrated test. The quantitative strand asks whether differences in confidence and outcomes are statistically real. The qualitative strand asks what patients say was happening. The two strands are analyzed separately, then merged. Neither has priority; neither is the “real” finding while the other decorates it.
Choosing convergent commits you to analyzing both strands fully before merging them. A convergent design in which the qualitative work is rushed, thinly coded, or treated as anecdote is not actually convergent – it is a quantitative study with quotes. The design named in MM Studio at the Overview step should match the work done in every subsequent step.
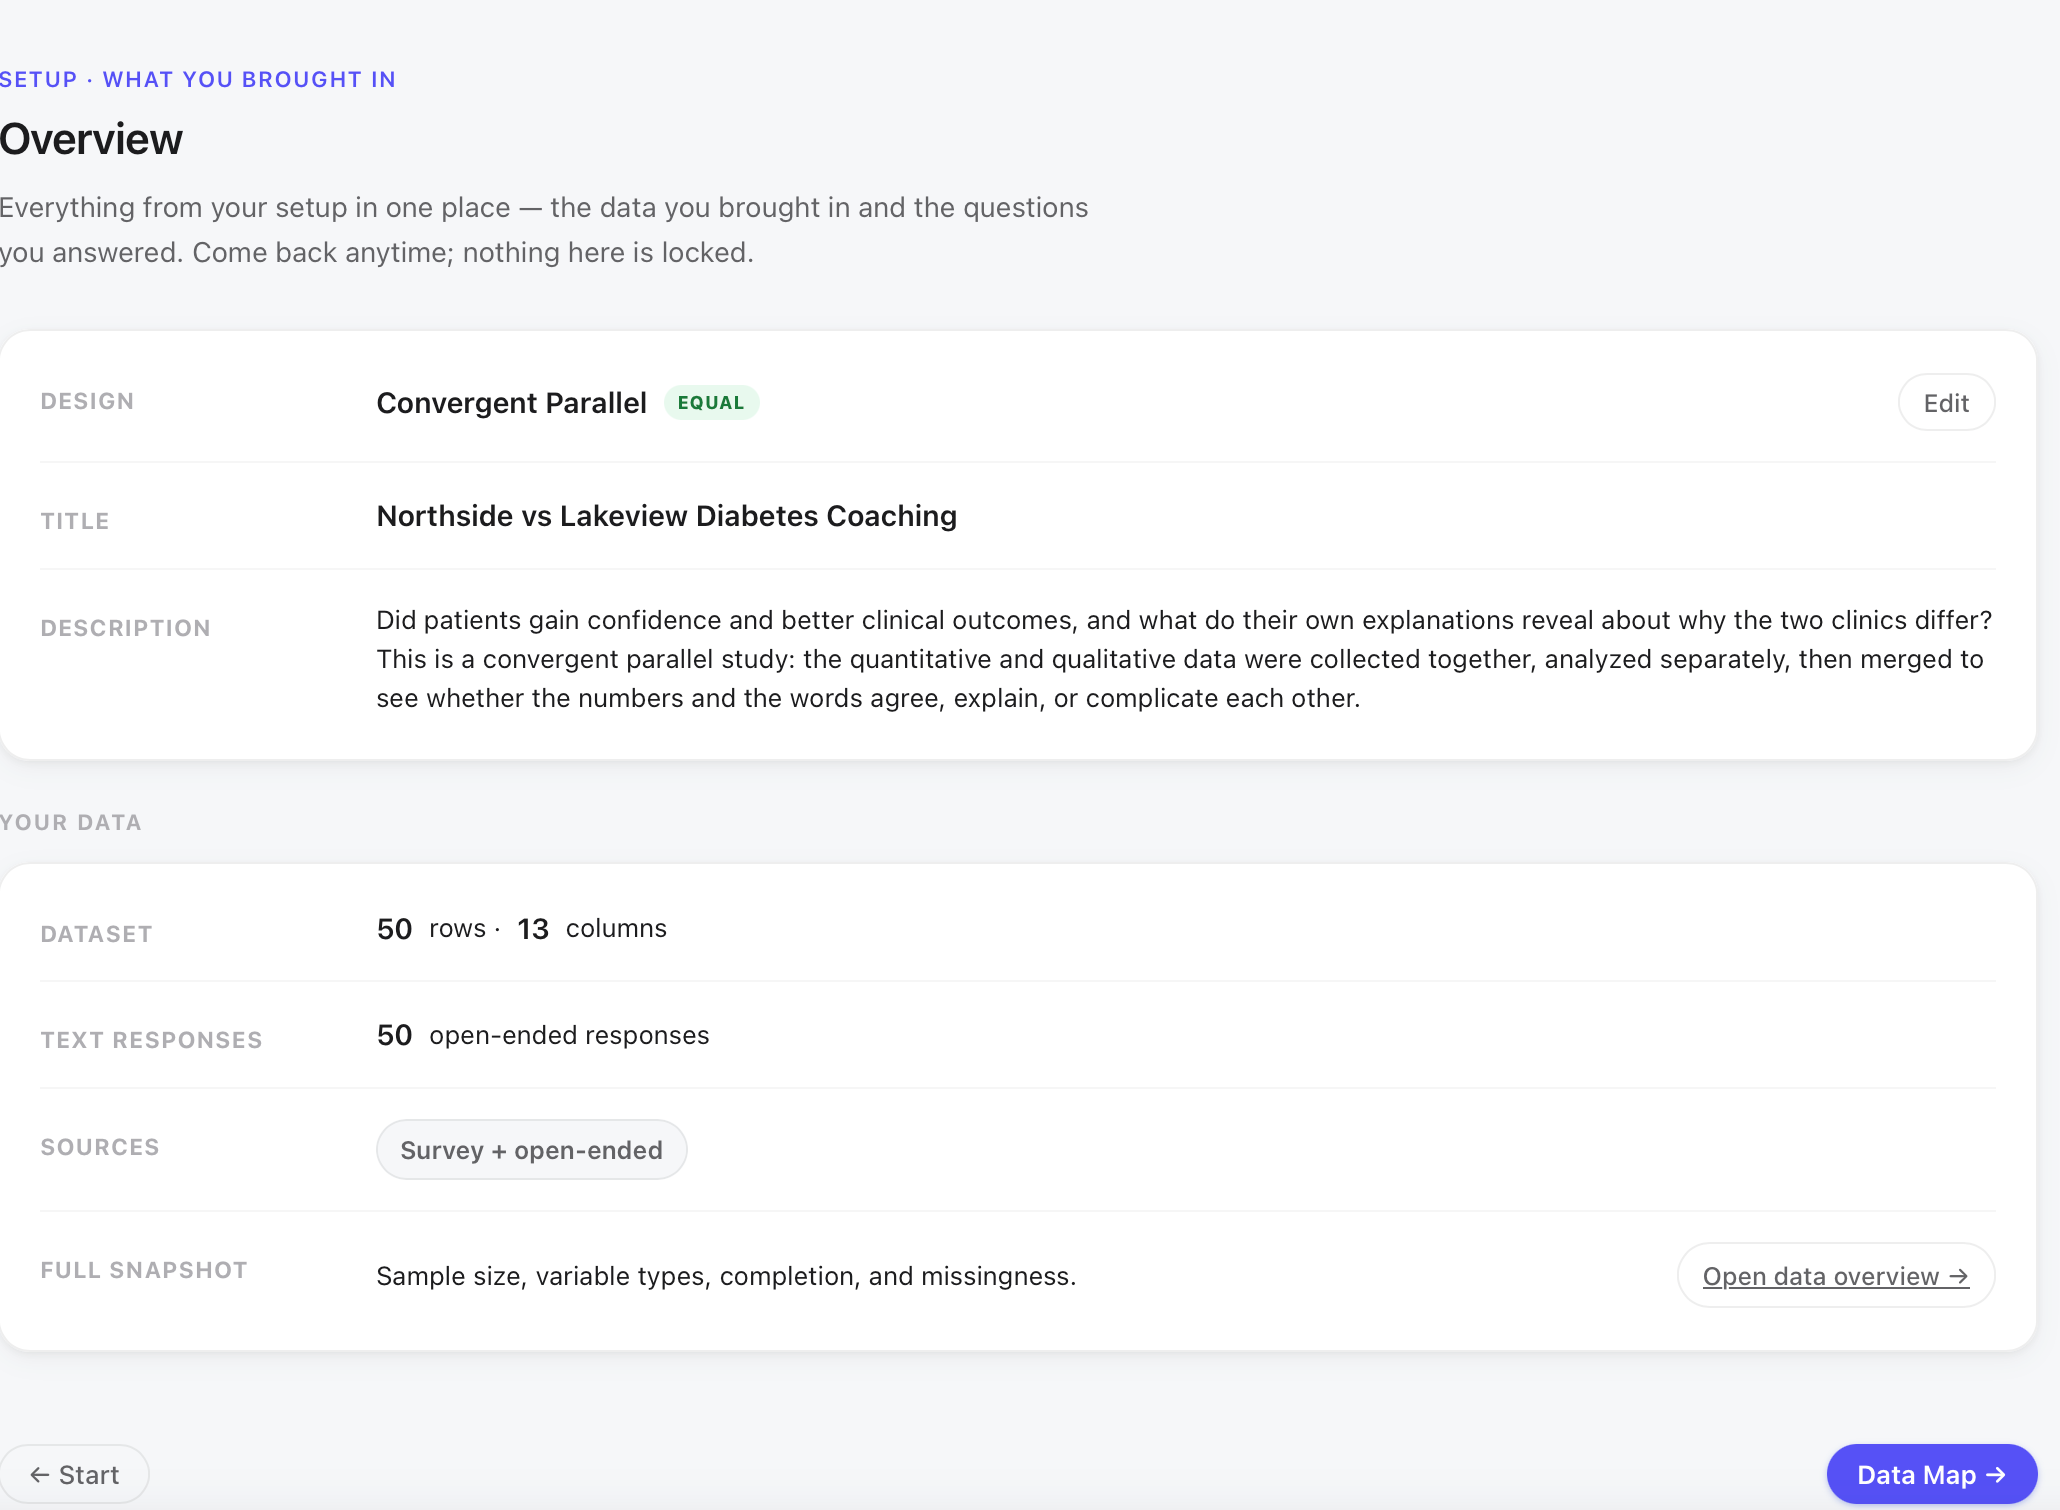
MM Studio names this project “Northside vs Lakeview Diabetes Coaching” with a design of Convergent Parallel. The description captures the core question: Did patients gain confidence and better clinical outcomes, and what do their own explanations reveal about why the two clinics differ? The description is not decorative – it appears throughout the report and keeps the team anchored to the original question when the analysis gets deep into individual statistics.
The Data Map – classifying thirteen columns before any analysis runs
MM Studio’s Data Map is Step 3 of 19. It reads the uploaded CSV and proposes a classification for each variable. You confirm or correct the proposals before analysis begins. No statistics run until the map is confirmed.
The fifty-patient dataset carries thirteen columns. They are not all the same kind of variable, and treating the wrong column as the wrong type produces wrong results invisibly. The Data Map is where you prevent that.
The thirteen columns and their roles
| Variable | Type / role | What it holds | Correction needed |
|---|---|---|---|
| patient_id | Identifier | Unique case ID, excluded from all analysis | None |
| clinic | Demographic · Grouping | Northside or Lakeview, the comparison variable for every test | Set role to Grouping |
| eff_1 – eff_5 | Likert · Scale item | Five self-efficacy items on a 1–7 scale, forming one construct | Assign construct name; exclude from outlier check |
| self_efficacy | Numeric · Scale score | Computed mean of eff_1–eff_5; this is the outcome in the t-test | Confirm as scale score, not raw Likert |
| sessions_attended | Numeric · Demographic | Count of coaching sessions; context variable, not primary outcome | None |
| overall_satisfaction | Likert · Scale item | Single satisfaction item; descriptive only in this study | None |
| a1c_improved | Demographic · Binary | Whether A1C improved from baseline, outcome for chi-square | Set to Binary; confirm role |
| completed | Demographic · Binary | Whether the patient completed the program; context variable | Set to Binary |
| open_response | Open-ended text | One qualitative response per patient, source for all theme coding | None |
MM Studio detects clinic as a numeric variable because the CSV stored clinic codes as numbers (1 = Northside, 2 = Lakeview). Left uncorrected, the software would treat clinic as a continuous variable and offer regression rather than group comparison. Setting the role to Grouping tells every downstream test which variable defines the groups. One wrong classification here propagates through all nineteen steps.
Binary variables, and why a1c_improved is not a Likert item
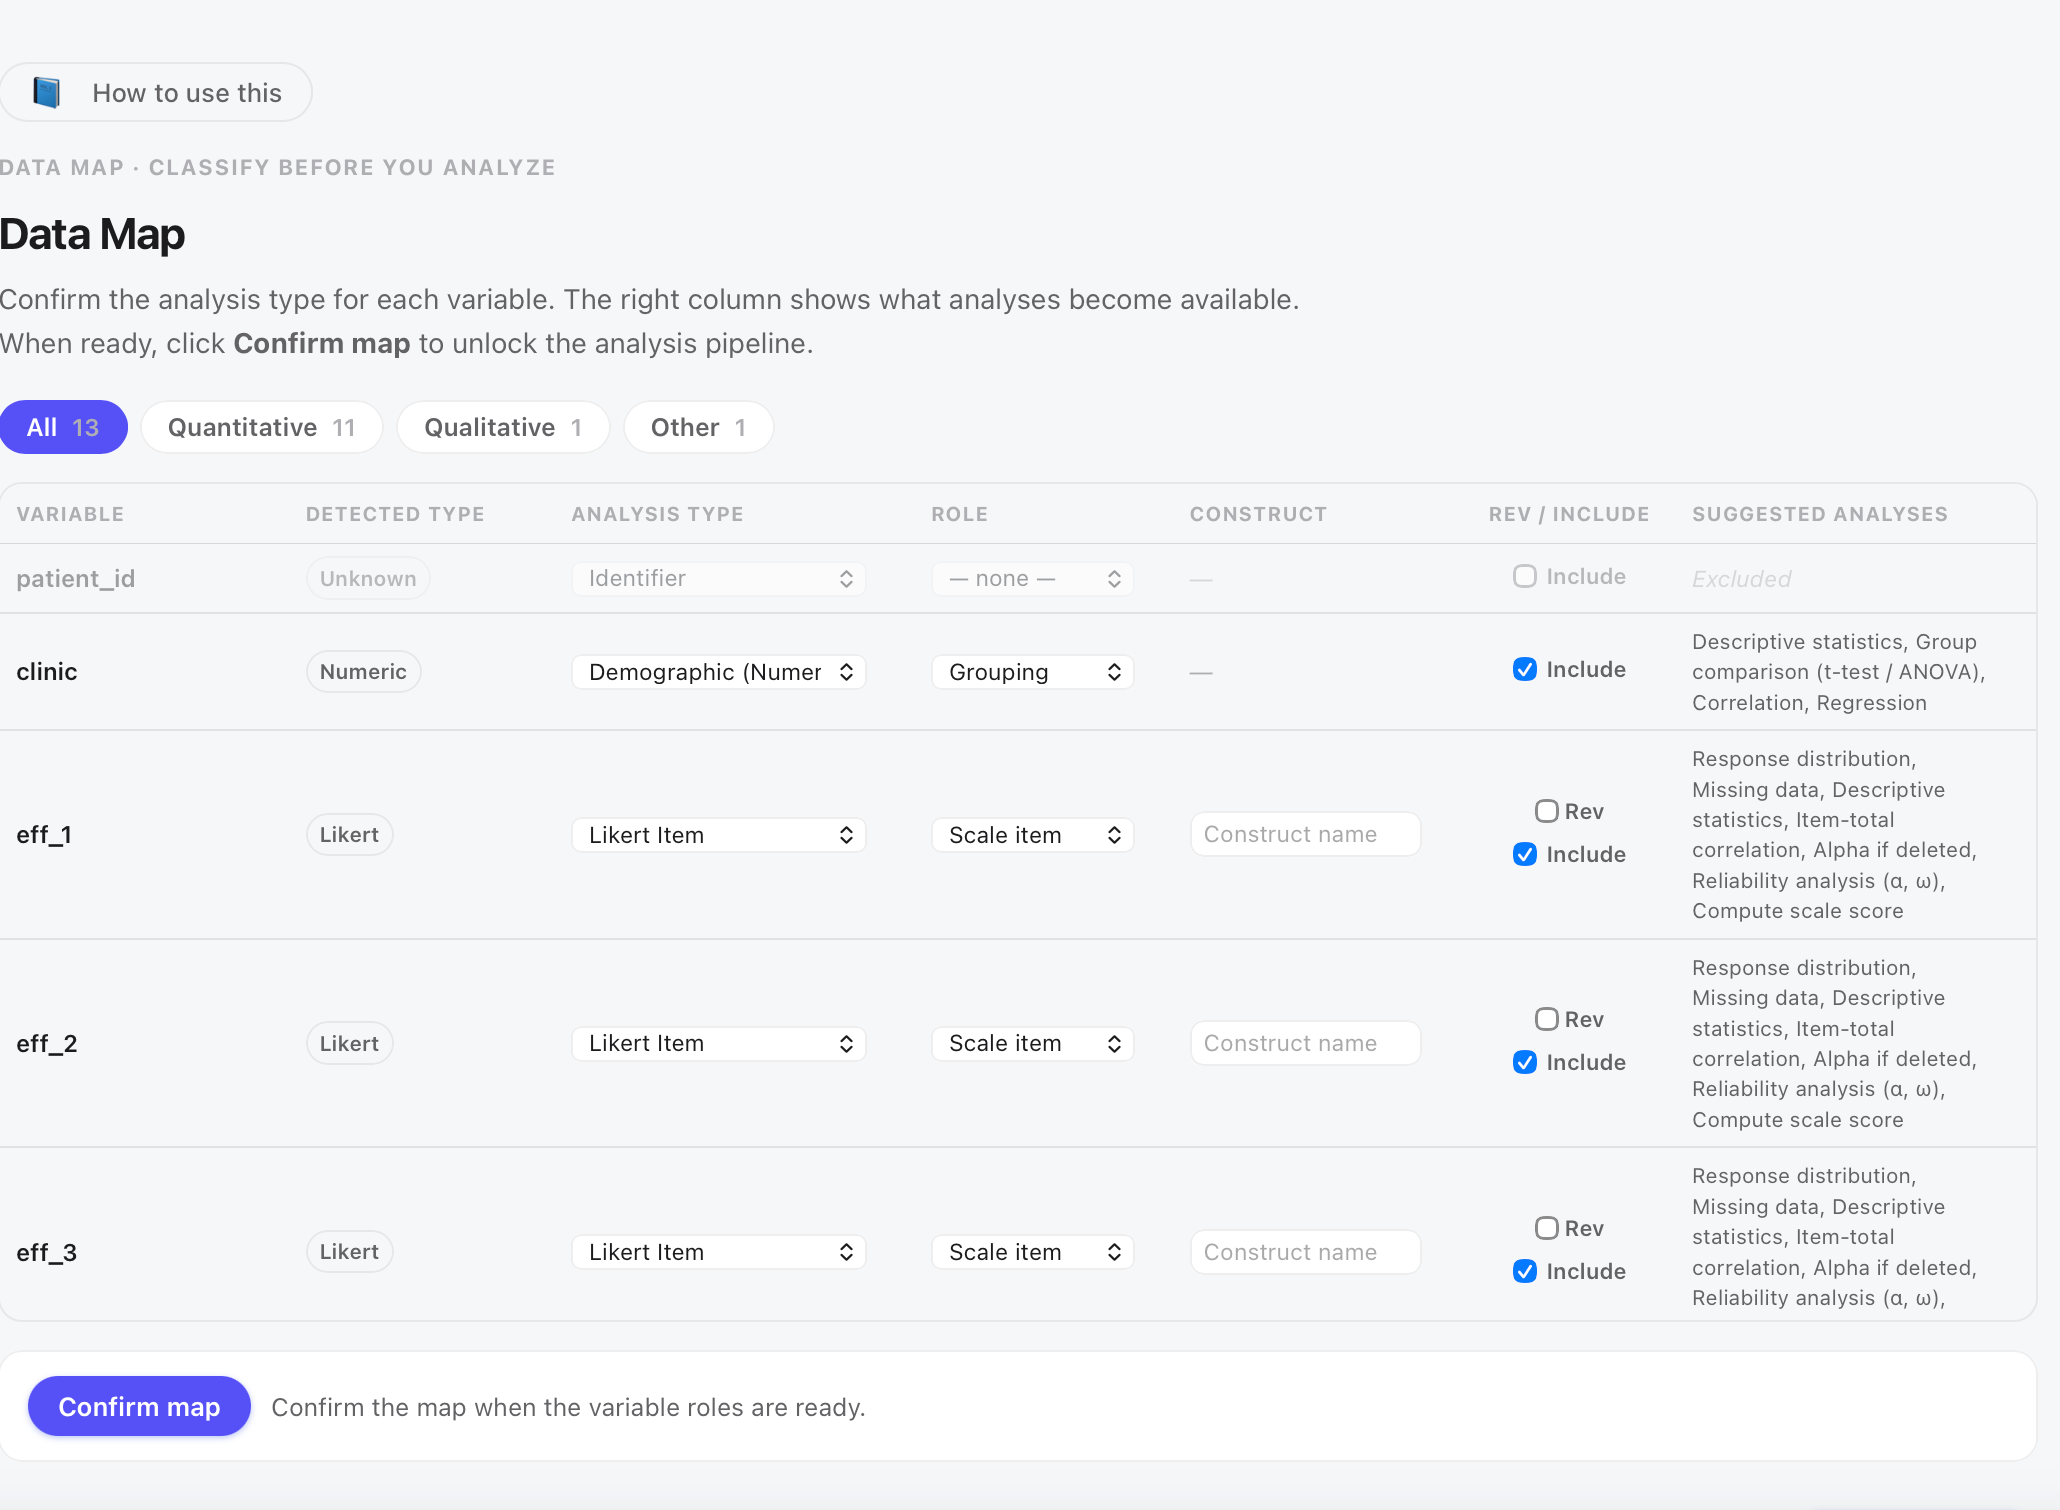
Scroll down the Data Map and two variables come into view that the software needs explicit instruction on: a1c_improved and completed. Both are stored as zeros and ones in the CSV. MM Studio proposes to treat them as Likert items, an understandable detection error, since 0/1 looks like a two-point scale to an automated classifier.
A binary outcome variable and a two-point Likert scale are not the same thing. One records a clinical fact; the other records a self-reported intensity. The analysis they unlock is different.
Once corrected to Binary, MM Studio routes a1c_improved to chi-square tests, phi coefficients, and logistic regression, the right tools for a yes/no outcome. The variable completed receives the same routing. Both are marked as Demographic in role because they describe the patient’s situation rather than measuring a psychological construct. They are not outcomes to be compared with the t-test; they are categorical facts to be cross-tabulated.
The five self-efficacy Likert items (eff_1 through eff_5) are rated on a 1–7 scale. A response of 1 or 7 is a valid, meaningful answer, not an extreme to be flagged and reviewed. The Data Map’s exclusion setting for ordinal Likert items prevents the Data Quality check from treating the full range of a scale as potential noise. The computed score self_efficacy is a continuous mean and does receive the standard Tukey outlier screen.
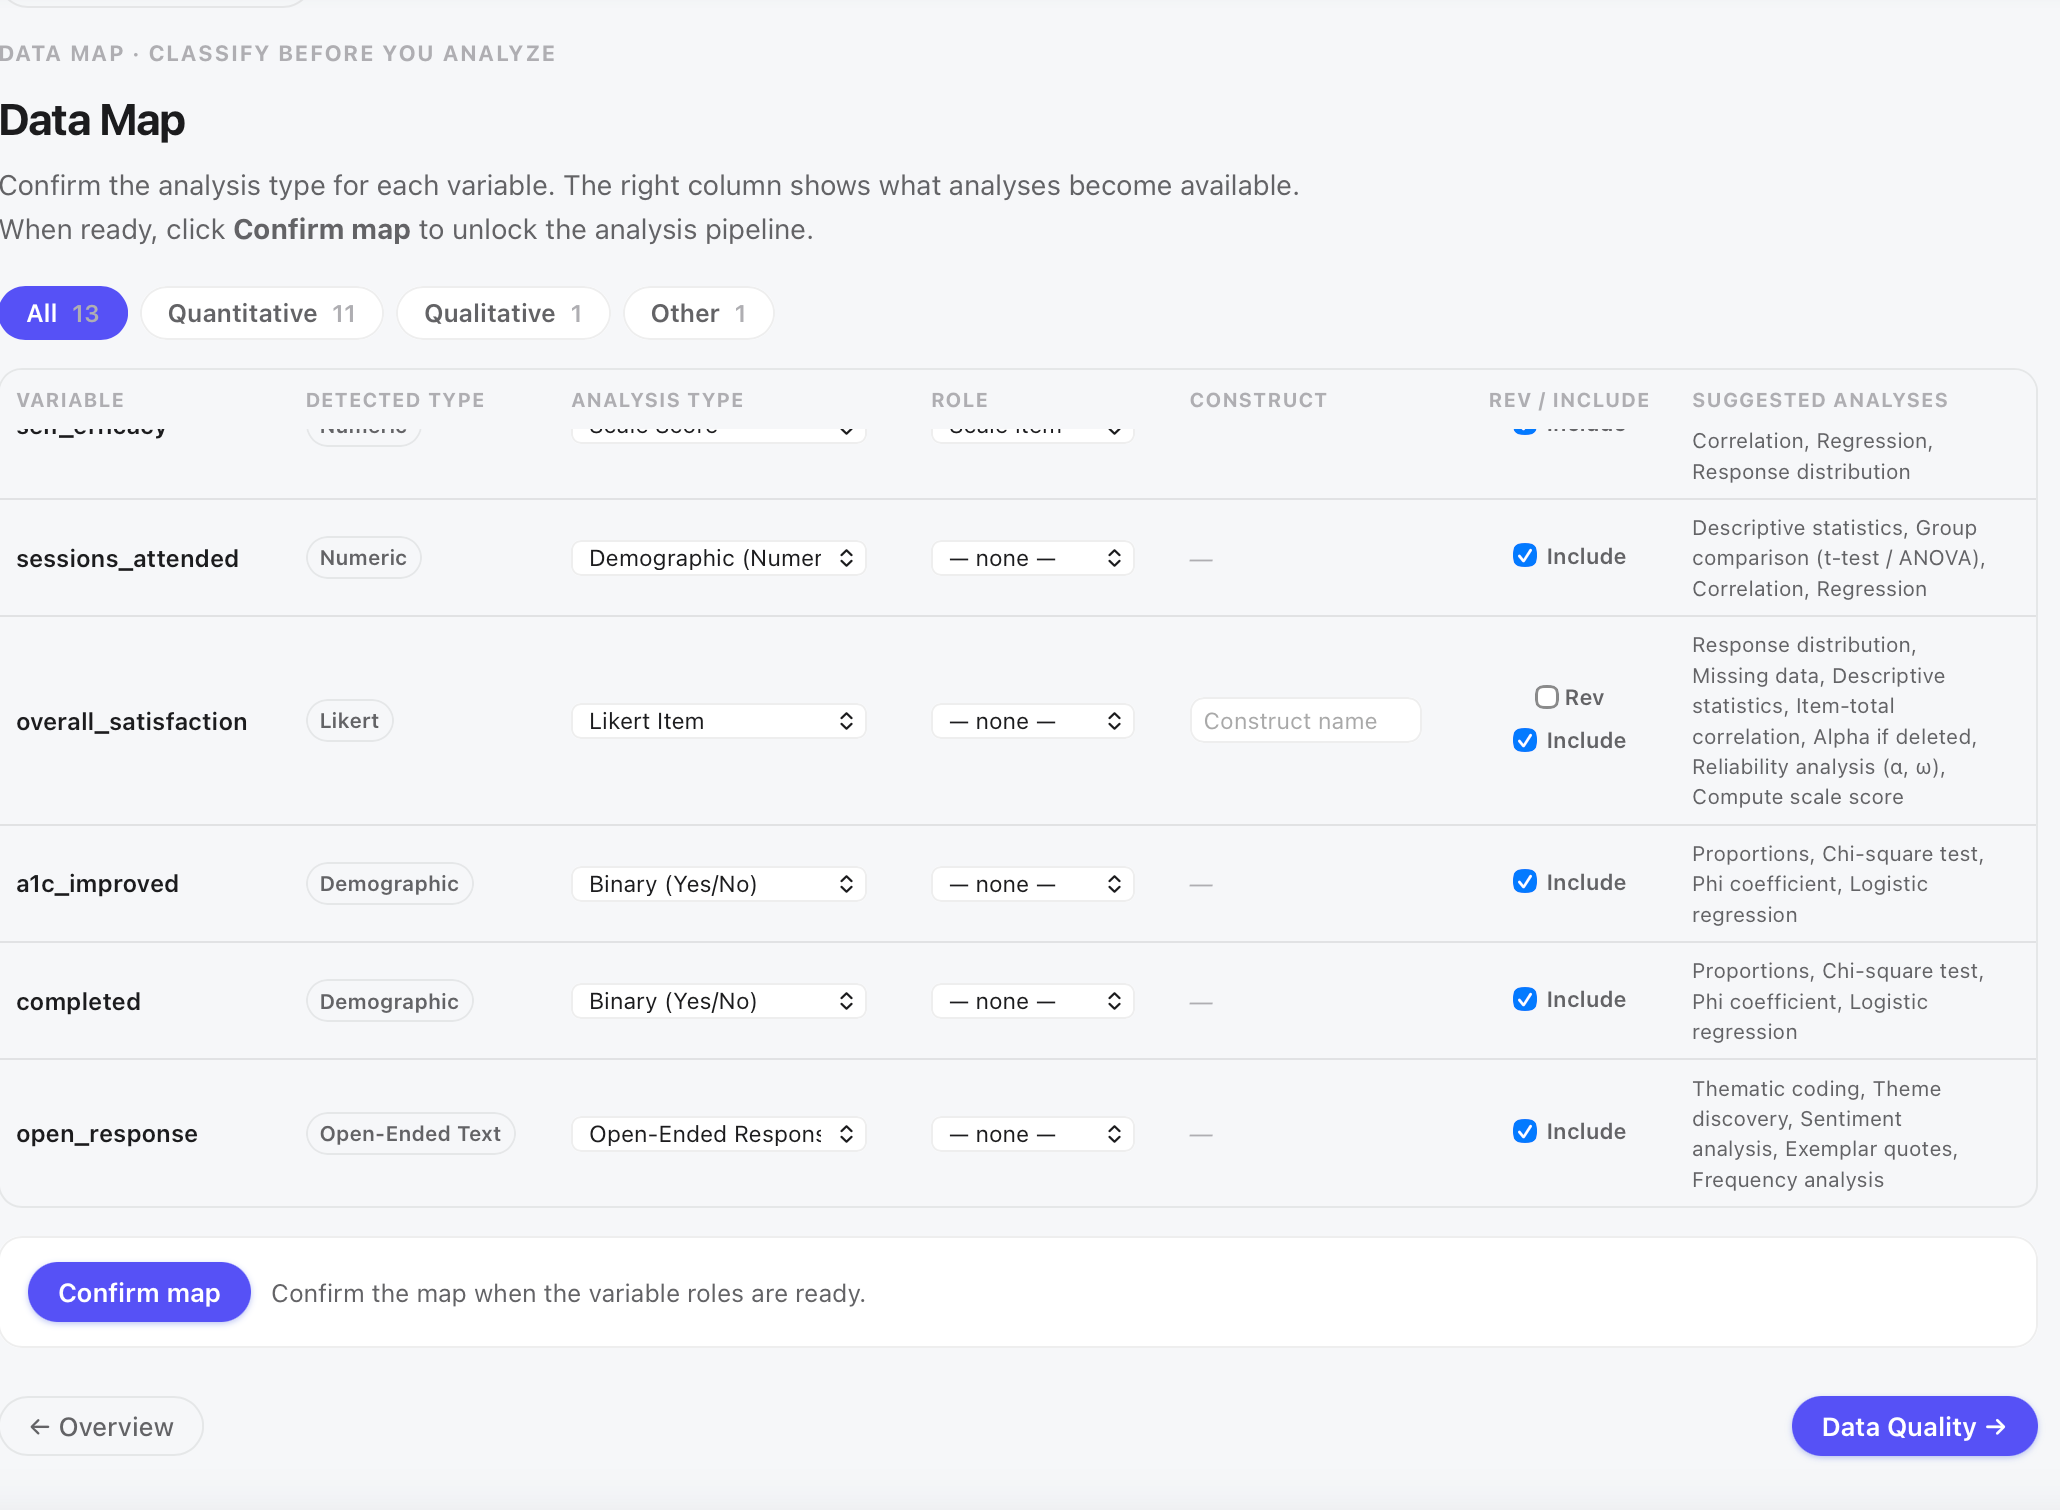
Once open_response is classified as Open-Ended Text, MM Studio creates a separate qualitative pipeline: Qualitative Themes (Step 7), Codebook and Evidence (Step 8), Theme by Group (Step 9), and Trustworthiness (Step 10). None of those steps exist unless the Data Map identifies at least one open-ended text column. The classification at Step 3 is what generates the QUAL side of the 19-step workflow.
Data Quality – seven checks before the analysis pipeline opens
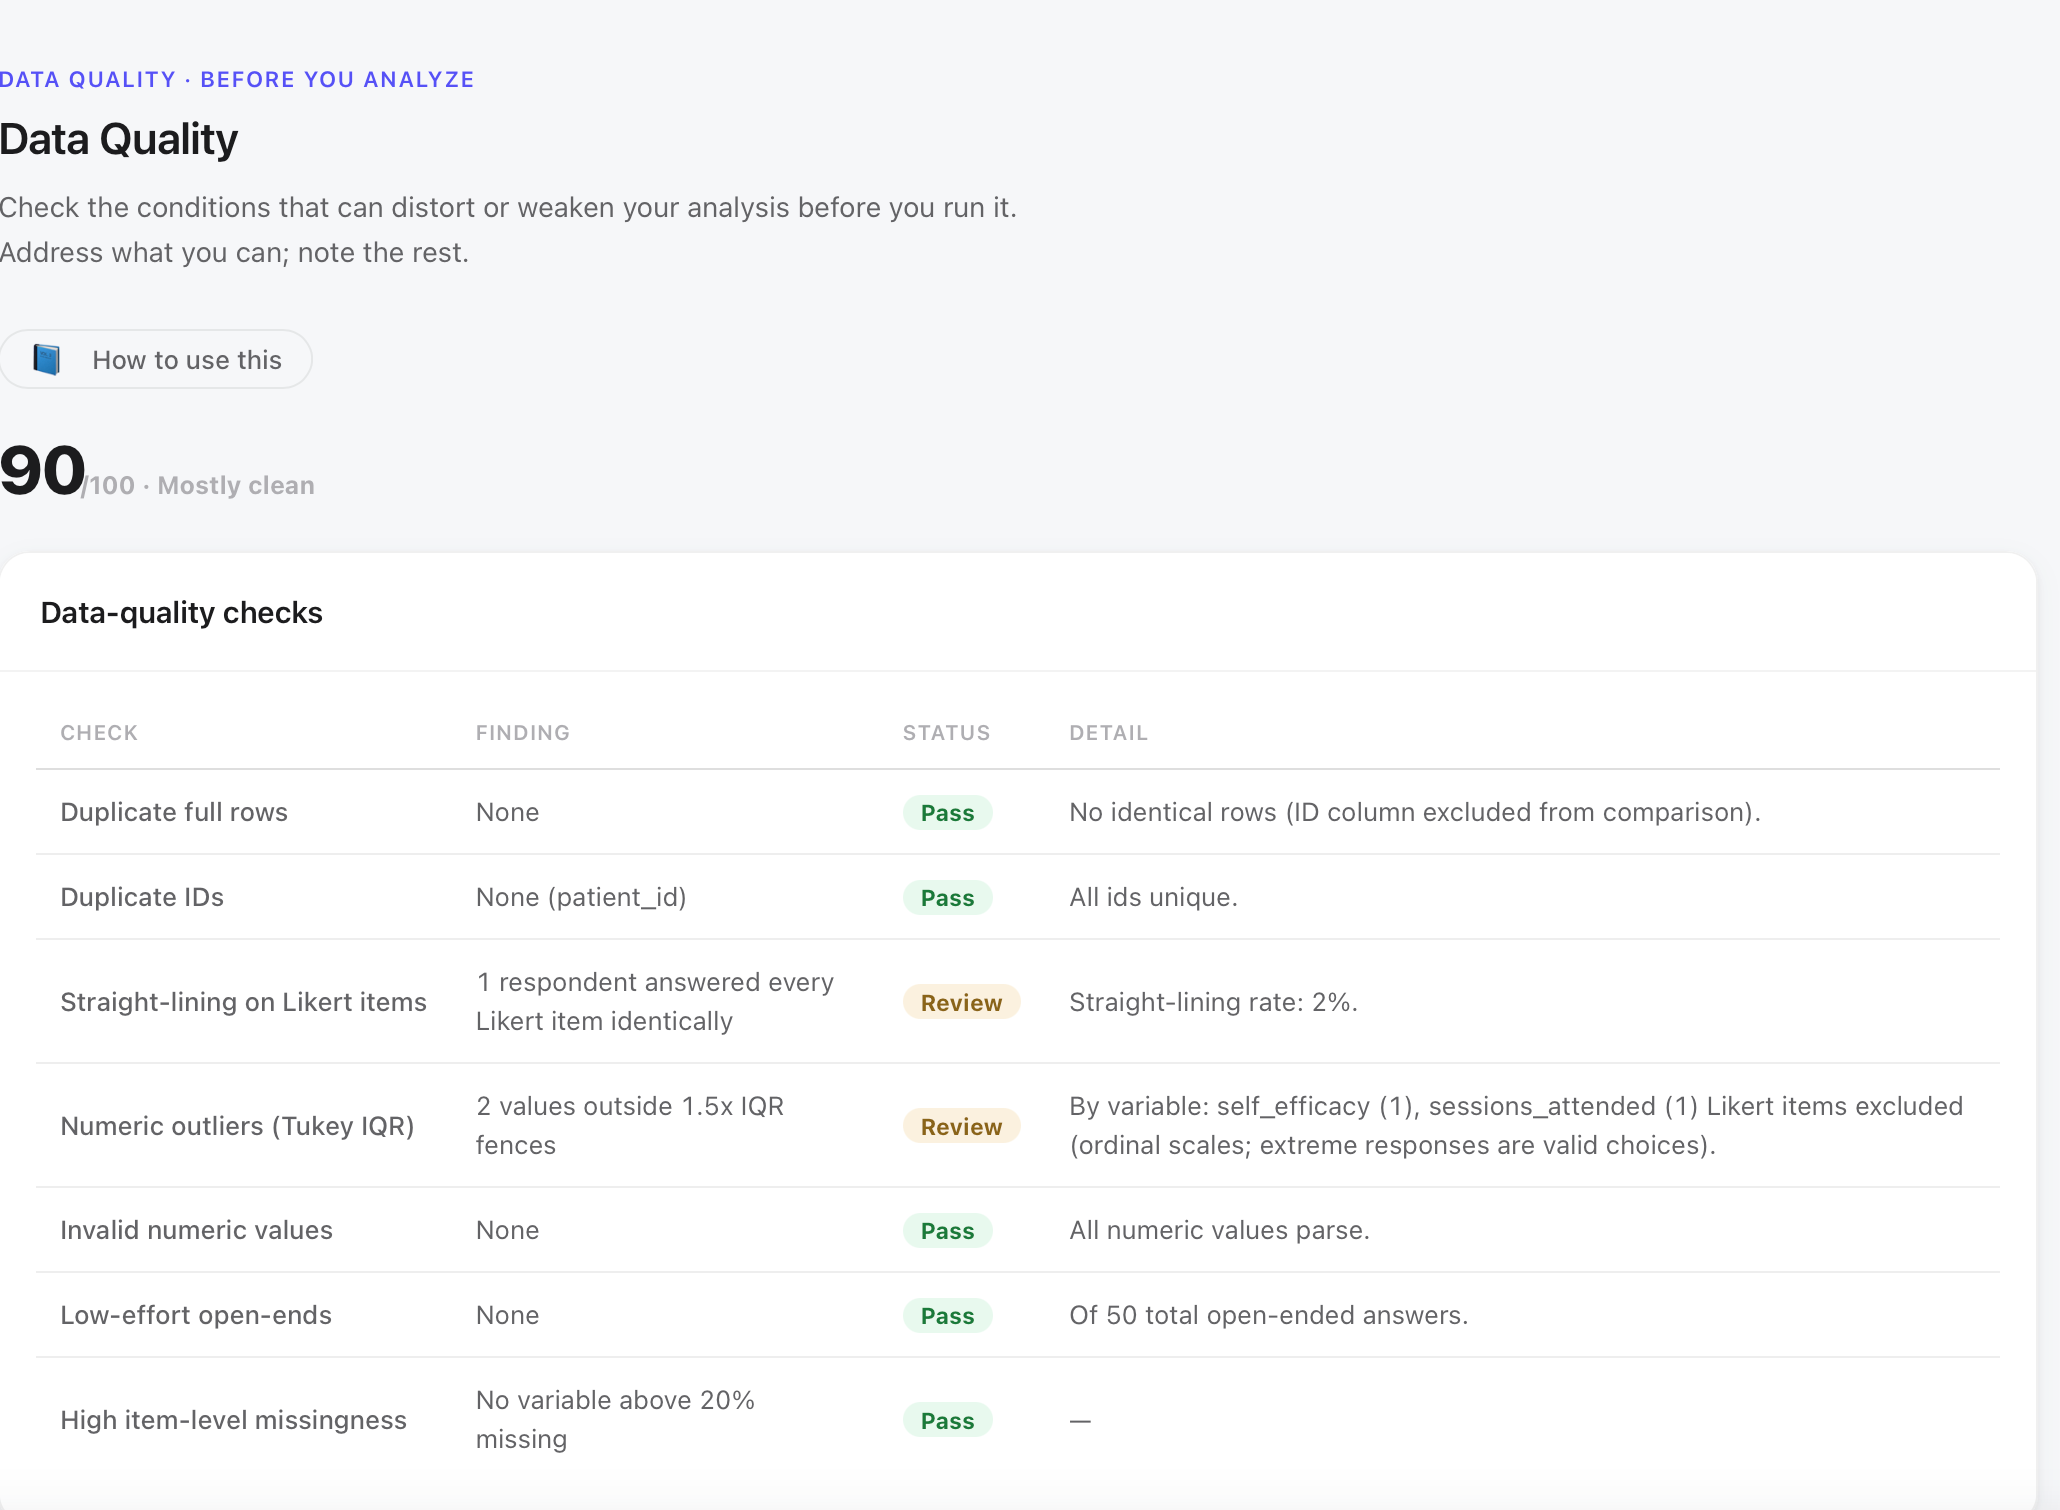
The Data Quality step (Step 4 of 19) runs seven automated checks and assigns each a status: Pass, Review, or flag. A score of 90/100 appears for this dataset, labeled “Mostly clean.” That number is a prompt to look at the two Review items, not a reason to skip reading them.
The seven checks and their results for this dataset:
| Check | Finding | Status | Decision |
|---|---|---|---|
| Duplicate full rows | None | Pass | No action |
| Duplicate IDs | None (patient_id) | Pass | No action |
| Straight-lining on Likert items | 1 respondent answered every item identically | Review | Straight-lining rate 2%. Below the threshold that warrants exclusion. Note in methods; retain. |
| Numeric outliers (Tukey IQR) | 2 values outside 1.5× IQR fences | Review | By variable: self_efficacy (1), sessions_attended (1). Likert items excluded from this check. Both are real patient values; keep. |
| Invalid numeric values | None | Pass | No action |
| Low-effort open-ends | None of 50 total | Pass | No action |
| High item-level missingness | No variable above 20% missing | Pass | No action |
What to do with Review flags: the reasoning, not just the outcome
Two checks land on Review. The goal of this lesson is to show the reasoning that turns a flag into a documented decision, not just the conclusion.
Straight-lining: 2%
One of the fifty respondents answered every Likert item with the same number, every self-efficacy item rated identically. This pattern can mean careless responding (clicking through without reading), or it can mean the respondent genuinely has the same level of agreement across all items. At 2%, one of fifty respondents, this rate is low. Studies in applied health contexts commonly report straight-lining rates of 5–15% before considering exclusion.
Decision: retain. Document in the methods section that 2% of respondents showed straight-lining. Note the case ID if visible. One case does not distort a 50-person mean enough to change any finding in this study. Exclusion at this rate would remove a real participant without clear methodological warrant.
Tukey outliers: two values
The Tukey method flags values that fall more than 1.5 times the interquartile range above or below the quartile fences. For self_efficacy, one patient scored at the lower end of the scale; for sessions_attended, one patient attended substantially fewer sessions than the rest of the cohort.
Decision: retain both. These are real patient values, not data entry errors. A patient who attended fewer sessions is exactly the kind of participant whose qualitative response may matter for understanding the access theme later. Removing outliers from a study that is specifically about variability between groups, when those outliers are real people with real experiences, undermines the purpose of the study. The Tukey flag is a prompt to look, not an instruction to delete.
The Data Map set eff_1 through eff_5 as ordinal Likert items. The Data Quality step honors that classification and excludes them from the Tukey screen. A response of 1 or 7 on a self-efficacy scale is not an outlier; it is the strongest possible response in either direction. Flagging the scale endpoints as extreme values would produce meaningless warnings on every Likert survey ever administered.
A data quality check is a prompt to look, not an instruction. The decision is yours, and it needs a documented rationale, not just a click.
All fifty open responses contain substantive content: no single-word filler, no repeated characters, no obviously blank submissions. Item-level missingness is below 20% for every variable. These two passes mean the qualitative pipeline opens with complete, usable data and the quantitative analyses will not need to manage missing values through imputation.
Exit ticket: defend the setup before the analysis begins
If you can answer these without looking, you understand the preparation, not just the clicks.
Why is this study a convergent parallel design rather than sequential?
What goes wrong if you leave clinic classified as numeric instead of setting it to Grouping?
A colleague wants to exclude the straight-lining respondent. What do you say?
Why are eff_1 through eff_5 excluded from the Tukey outlier check?
What does a data quality score of 90/100 tell you, and what does it not tell you?
Two clinics, same program, different outcomes. Before any analysis can speak to that puzzle, the dataset needs thirteen columns classified correctly, two binary variables set to the right type, Likert items shielded from outlier checks that do not apply to them, and two Review flags read and documented. That is what the setup steps do. Part 2 opens with a clean dataset and a clear question.
Methods language for the setup steps
Use these when writing the data and procedure sections of a manuscript.
Guide 02: Quantitative and Qualitative Analysis. ReliCheck MM Studio · Mixed Methods Teaching Guide 01 of 03. Part 1: Introduction and Data Prep · Study: Northside vs Lakeview Diabetes Coaching · N = 50.