
ReliCheck Quanta Statistics software for the Mac. True to your research.
This is Quanta, statistical software for Mac. Click around.
The statistics software Mac researchers actually reach for: validated for social, behavioral, and health science, and built the way you work. Every stage of quantitative research, from scale reliability with alpha and item-total diagnostics through to advanced modeling. These tabs are real. Try one.
 ReliCheck Quanta

Quanta for the daily work. Advanced for the heavier models.
Every researcher starts with Quanta. When a study calls for multilevel, latent class, survival, mediation, or invariance models, the Advanced tier adds them inside the same app, validated the same way.
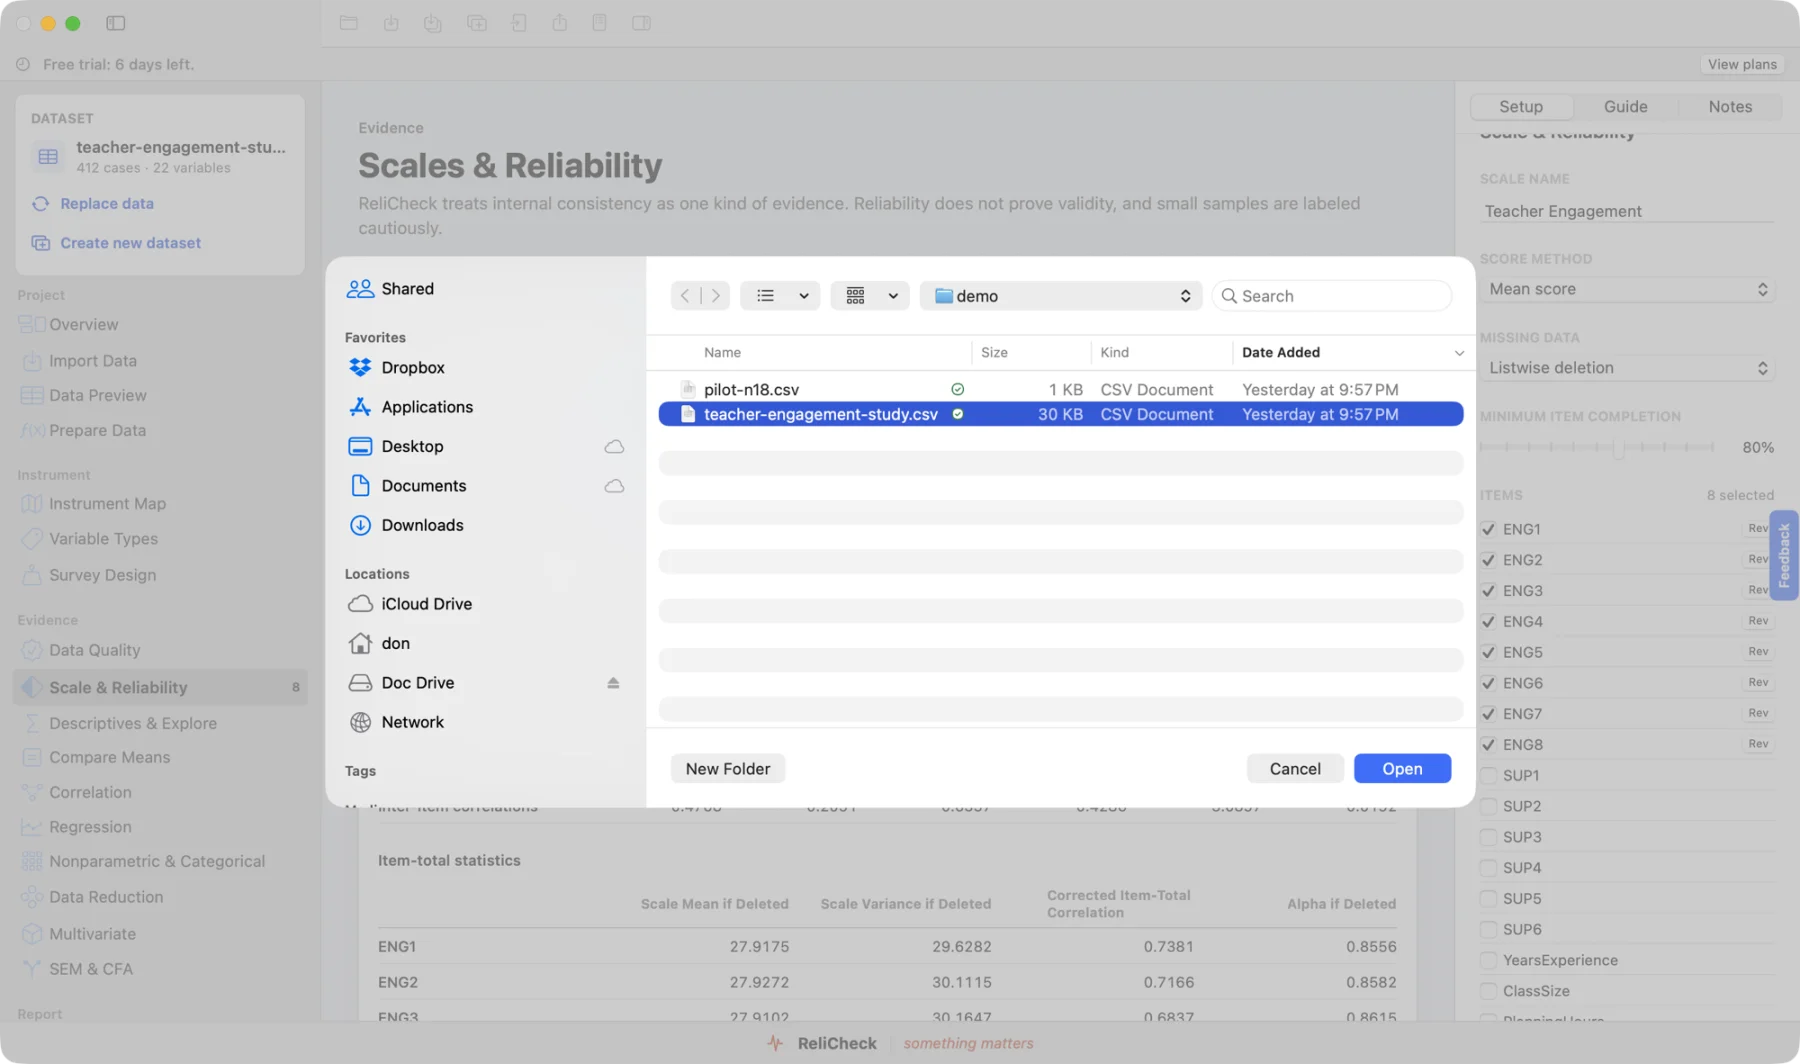
Start from the file you already have.
CSV, Excel, SPSS, Numbers. Drop it in.
Whatever your survey tool exported, Quanta reads it. The import dialog checks the structure before you do anything else.
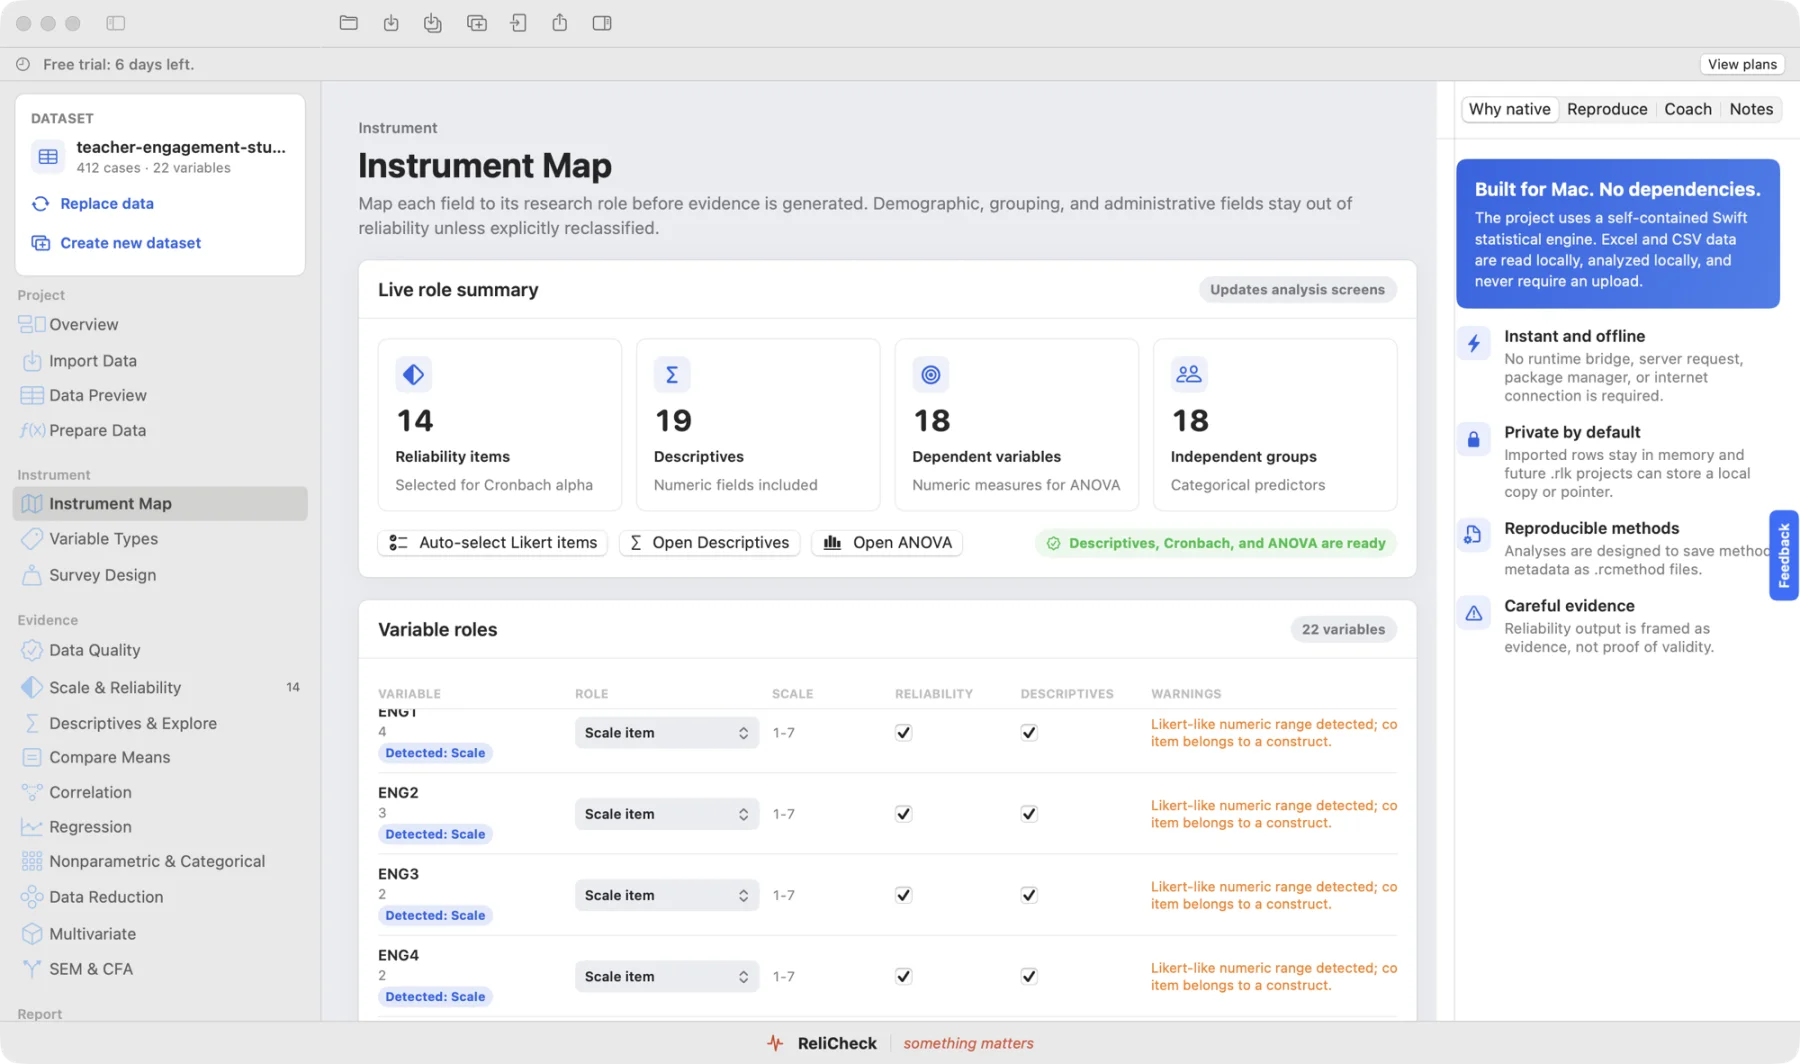
Variable types, sorted on arrival.
Scales, categories, and identifiers detected and classified as the file lands. You confirm in the Data Map instead of declaring everything by hand.
Then the part every other package makes you dig for: the evidence, laid out in front of you.
Every result arrives already explained.
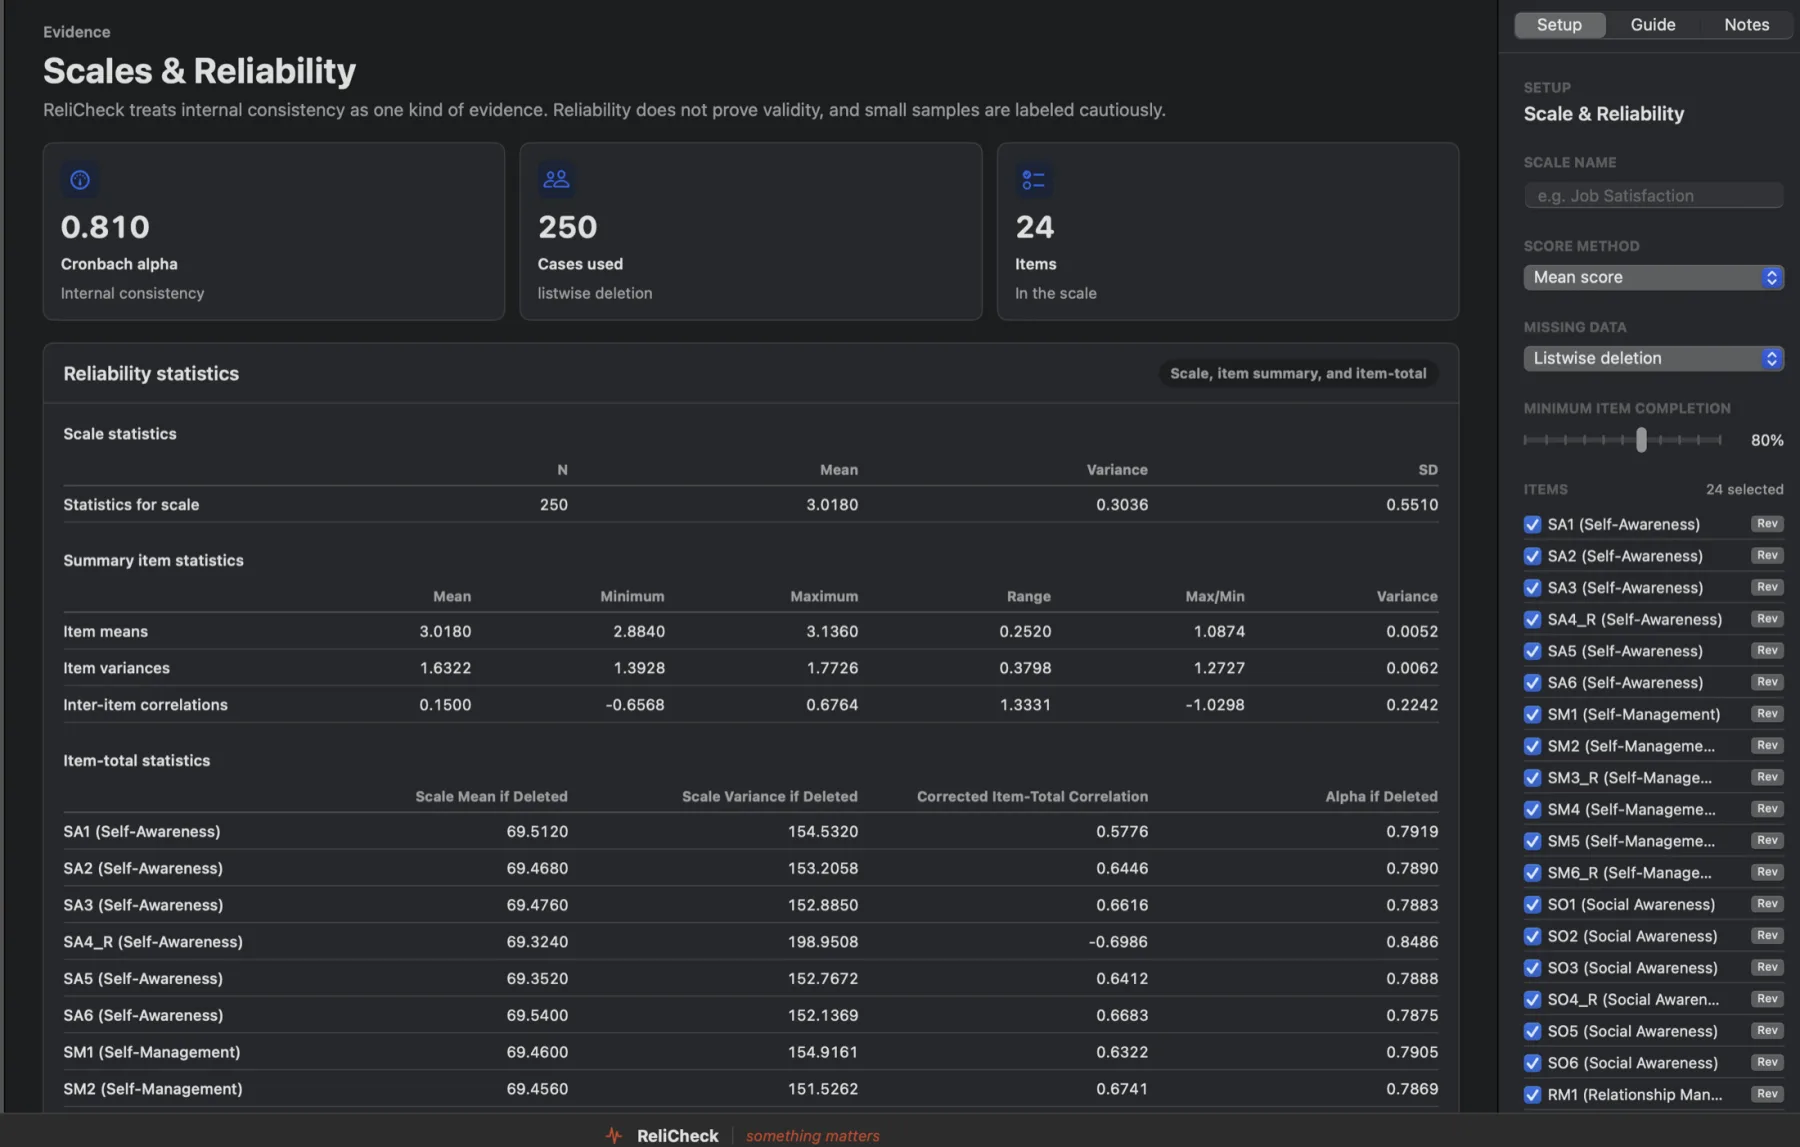
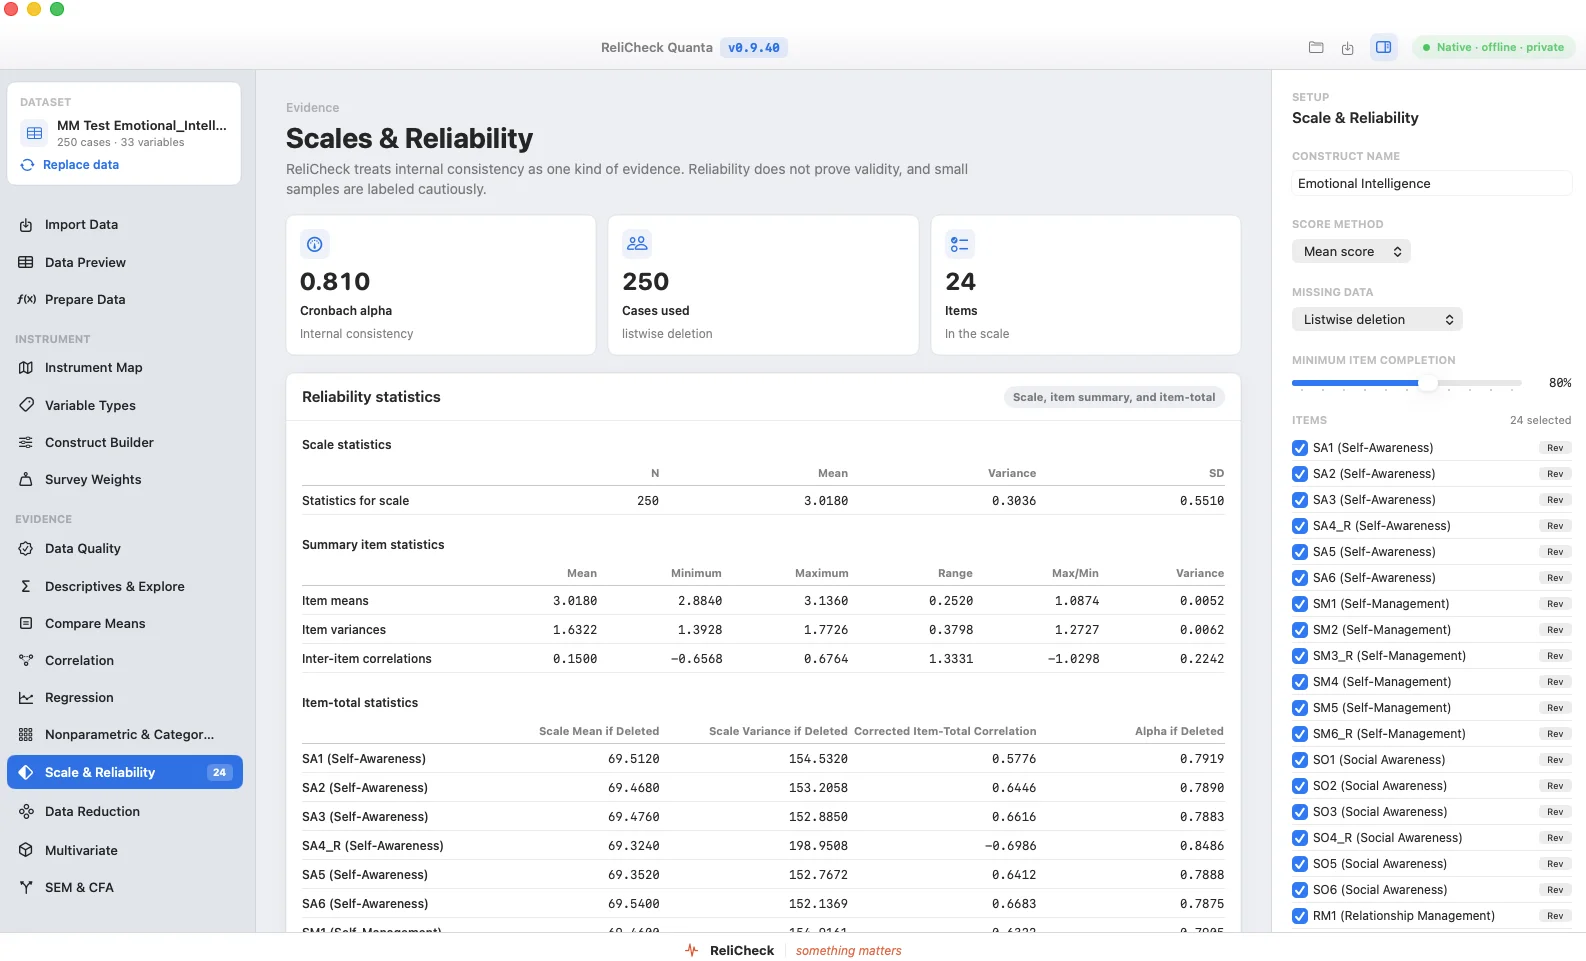
Every item, on one screen.
Cronbach's alpha, McDonald's omega, and the item diagnostics together, so the scale's health is one look, not five menus.
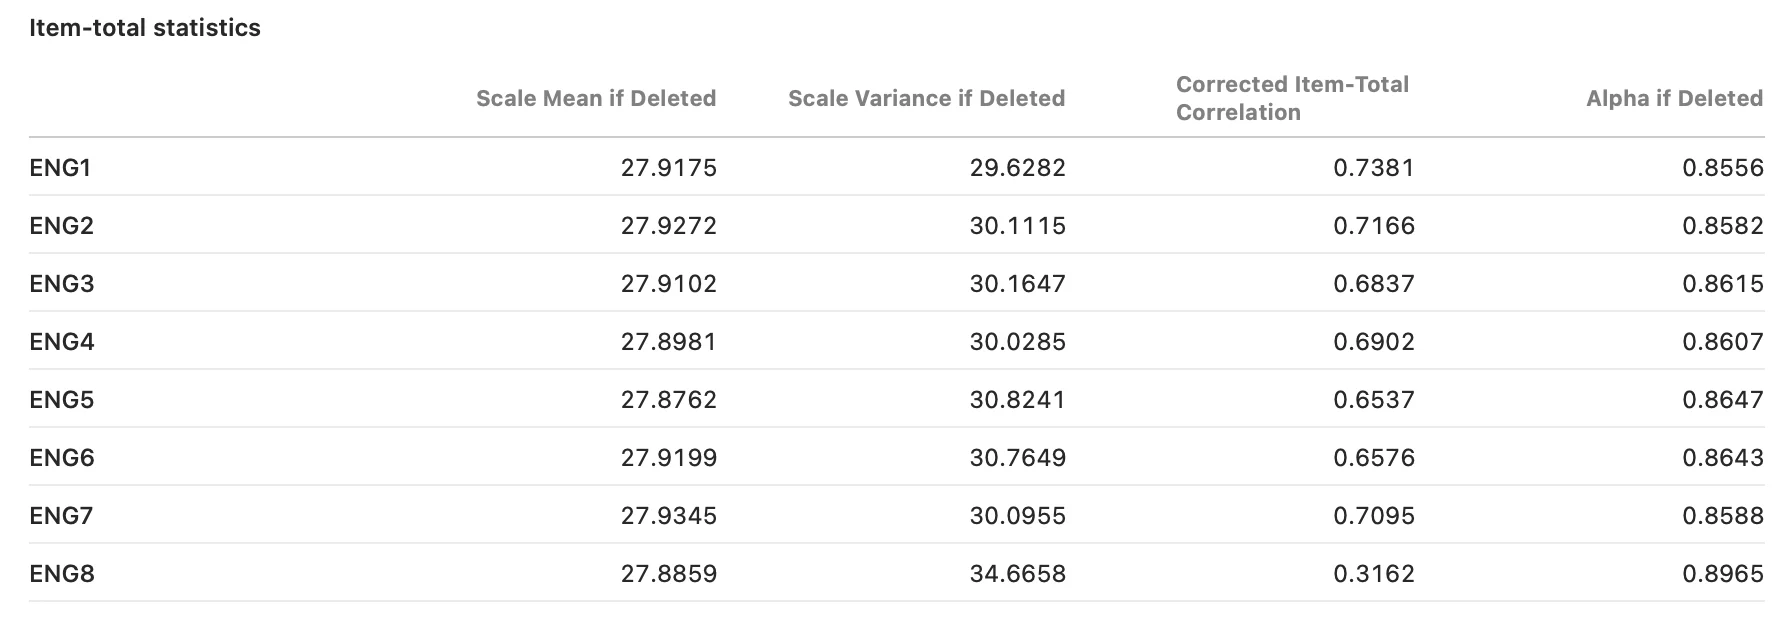
Know which item is dragging the scale.
Item-total statistics and alpha-if-deleted, side by side. The weak item has nowhere to hide.
Correlations that arrive publication-ready.
The matrix formats itself to APA as it computes. What you see is what the manuscript gets.
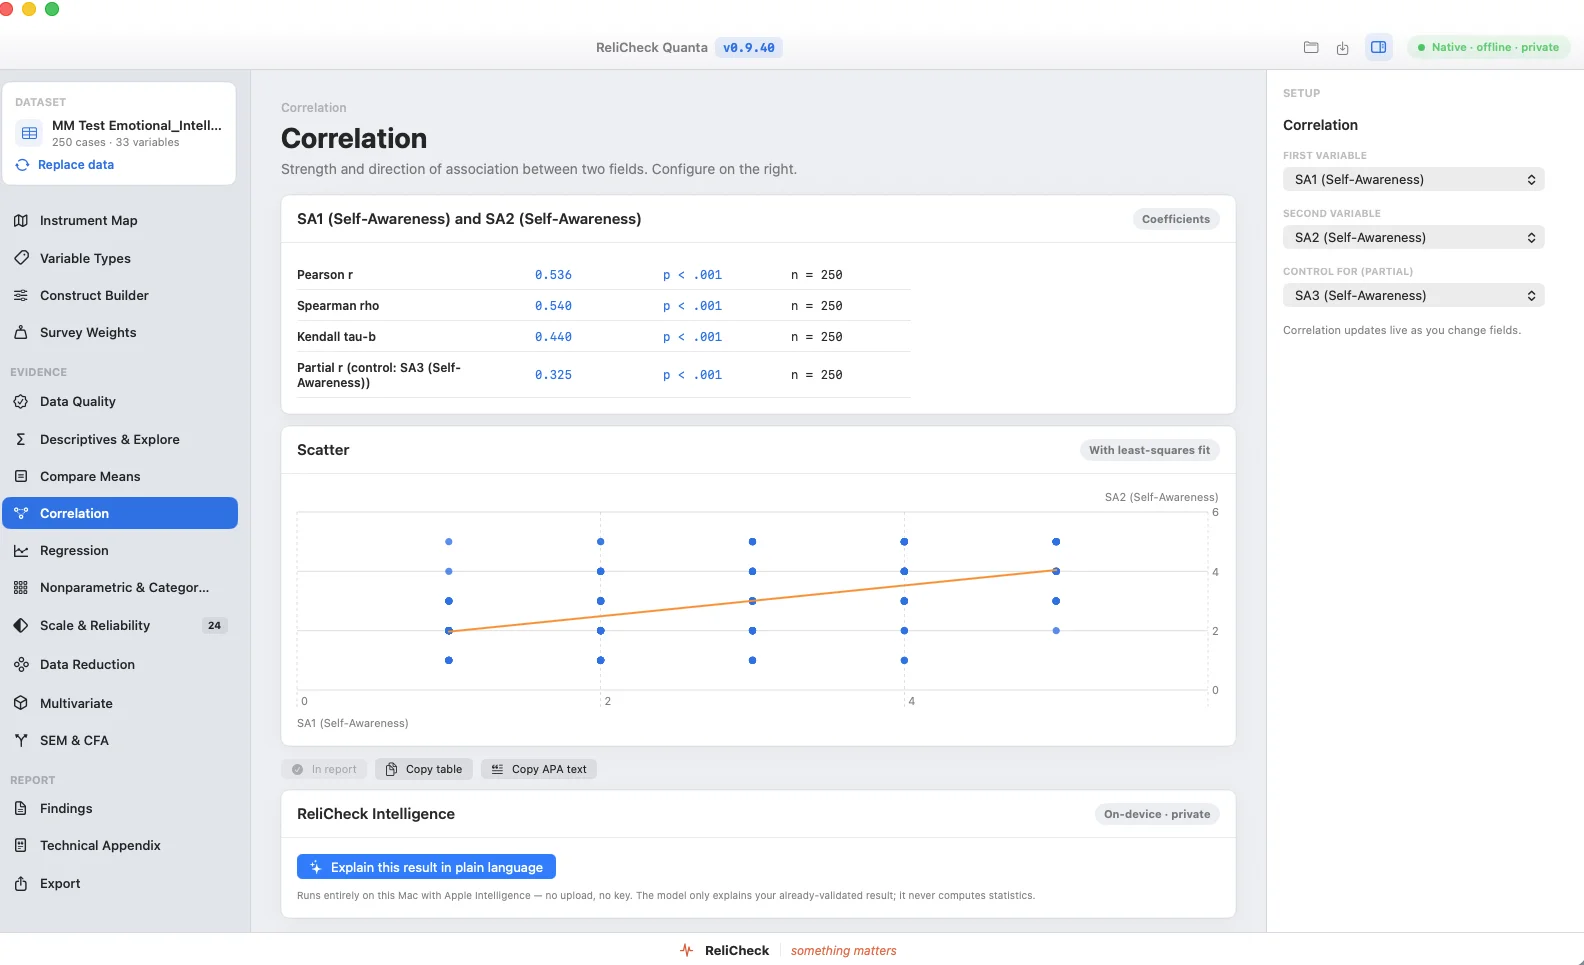
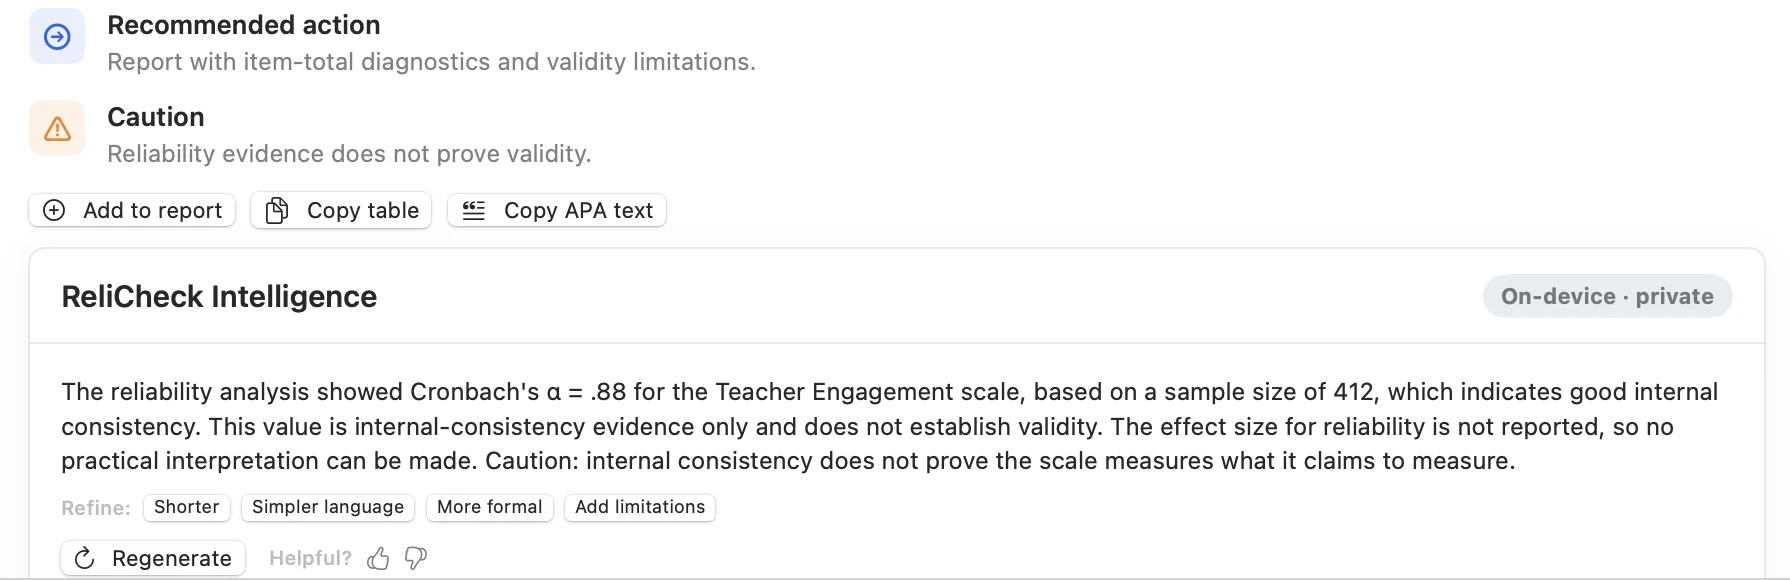
A plain-language read under every result.
ReliCheck Intelligence writes a sentence explaining what the number means, underneath the number. It runs on your Mac, so nothing is sent anywhere to produce it.
And when the analysis is done, the writing is already started.
Findings become a report as you go.
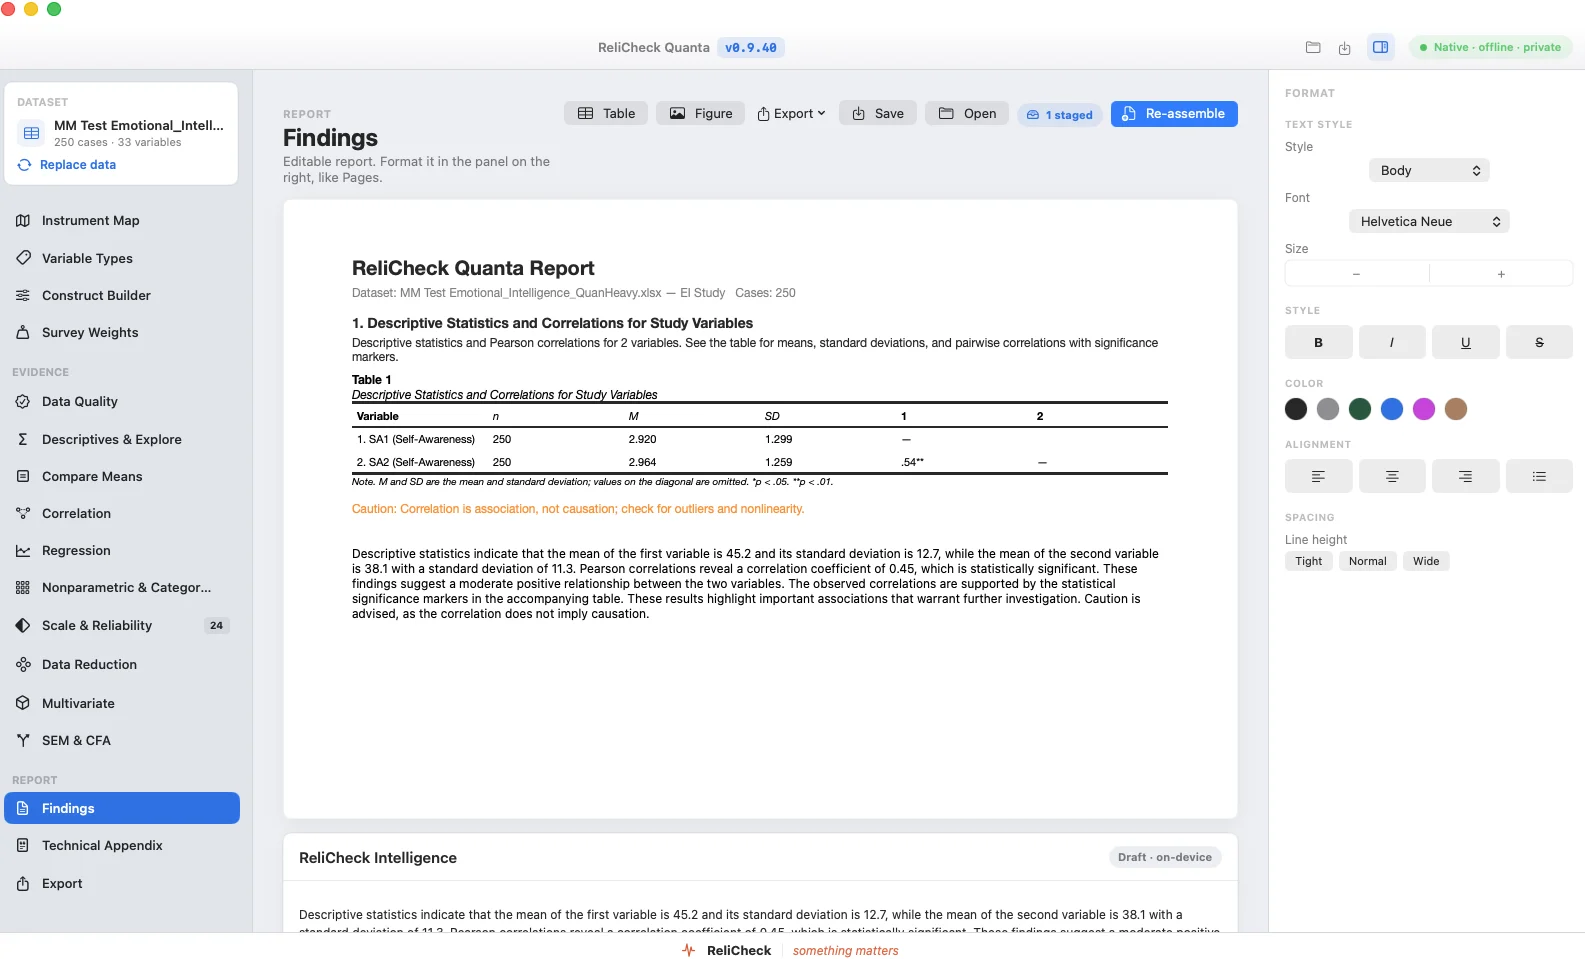
Results collect into an editable report.
No final assembly step. Each result you keep joins the report, APA-formatted, as you work. You write around the tables instead of rebuilding them.
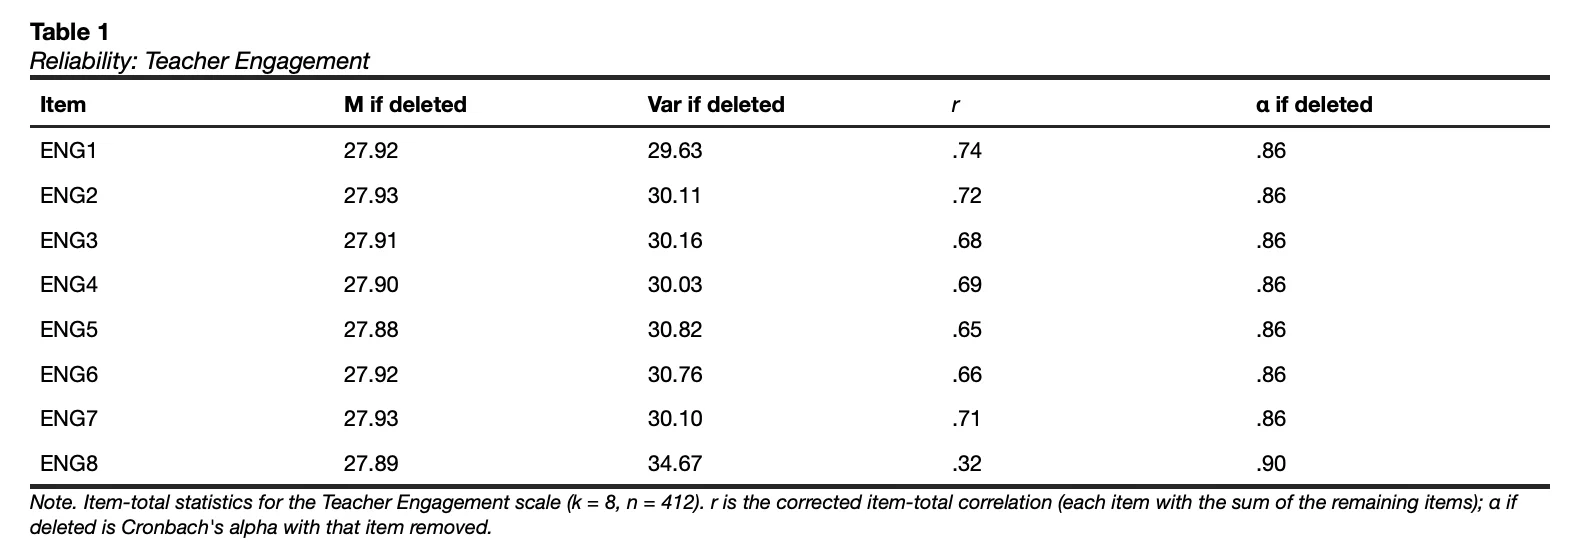
Tables that already follow APA 7.
Leading zeros, italics on the right symbols, notes in the right order, df where APA puts it.
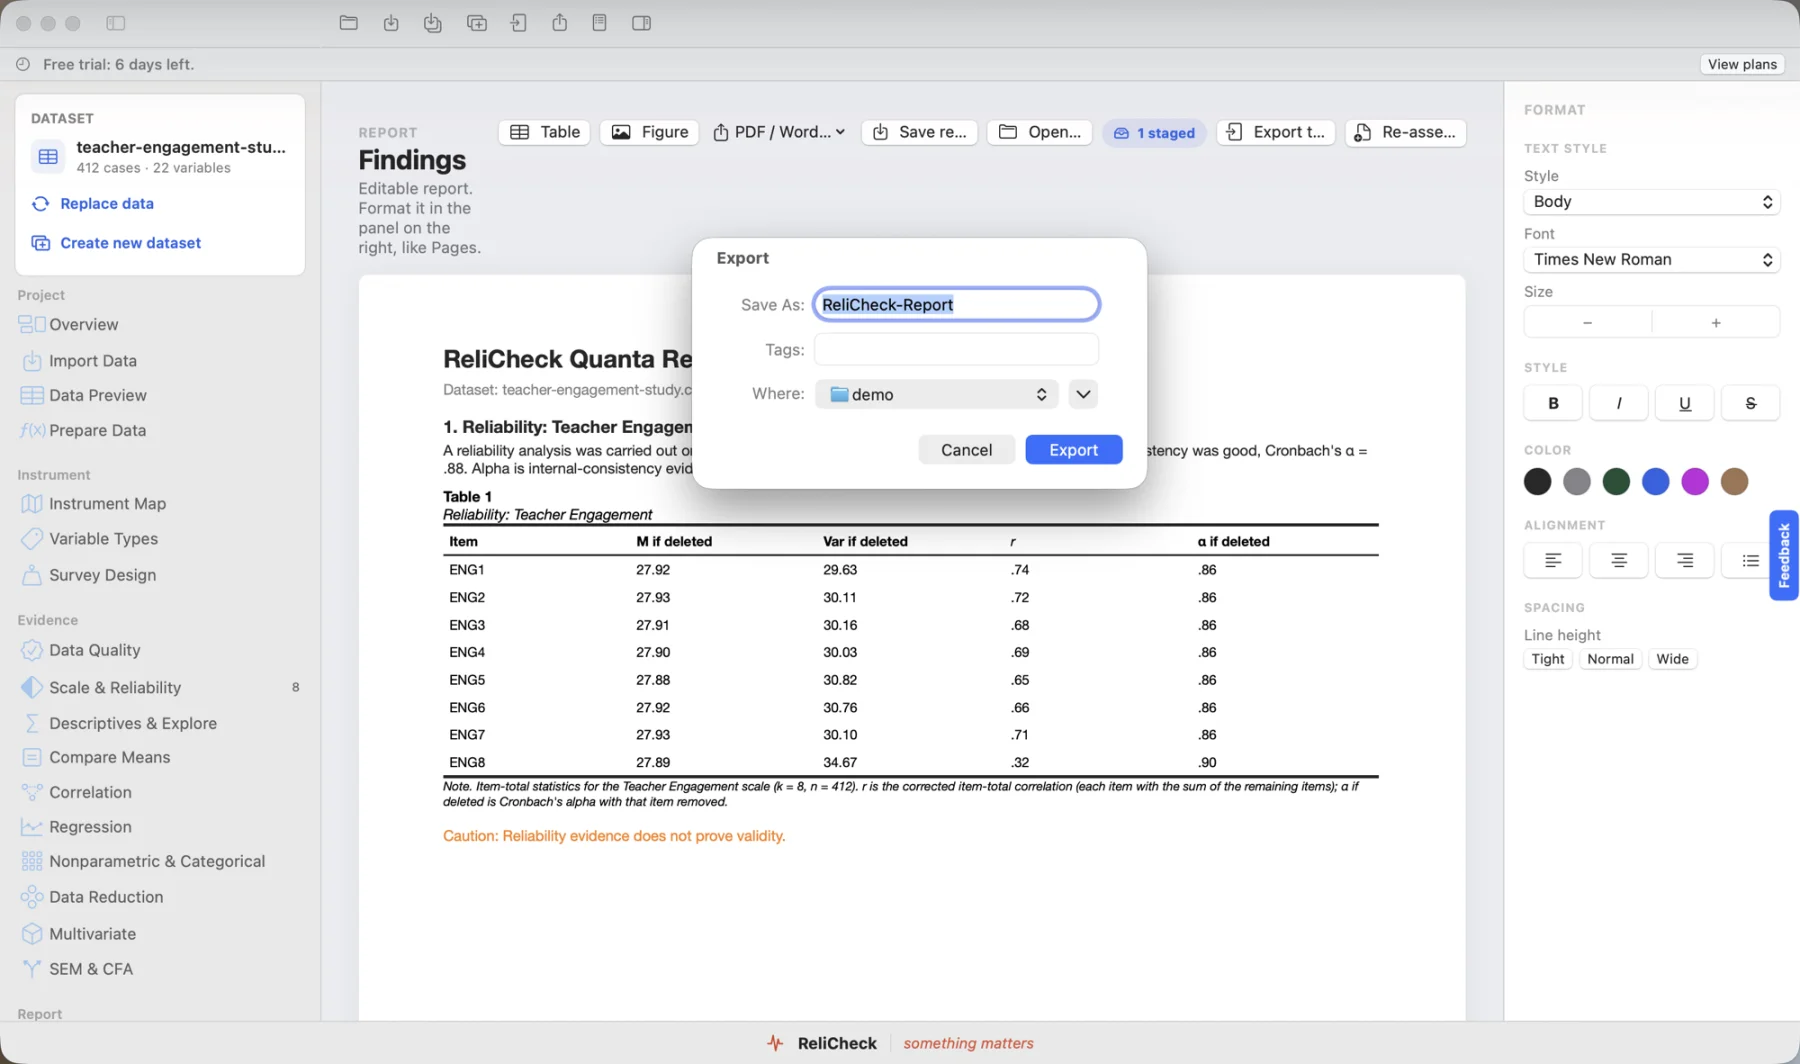
Word, PDF, or RTF, formatting intact.
The hour of reformatting between the output window and the manuscript disappears.
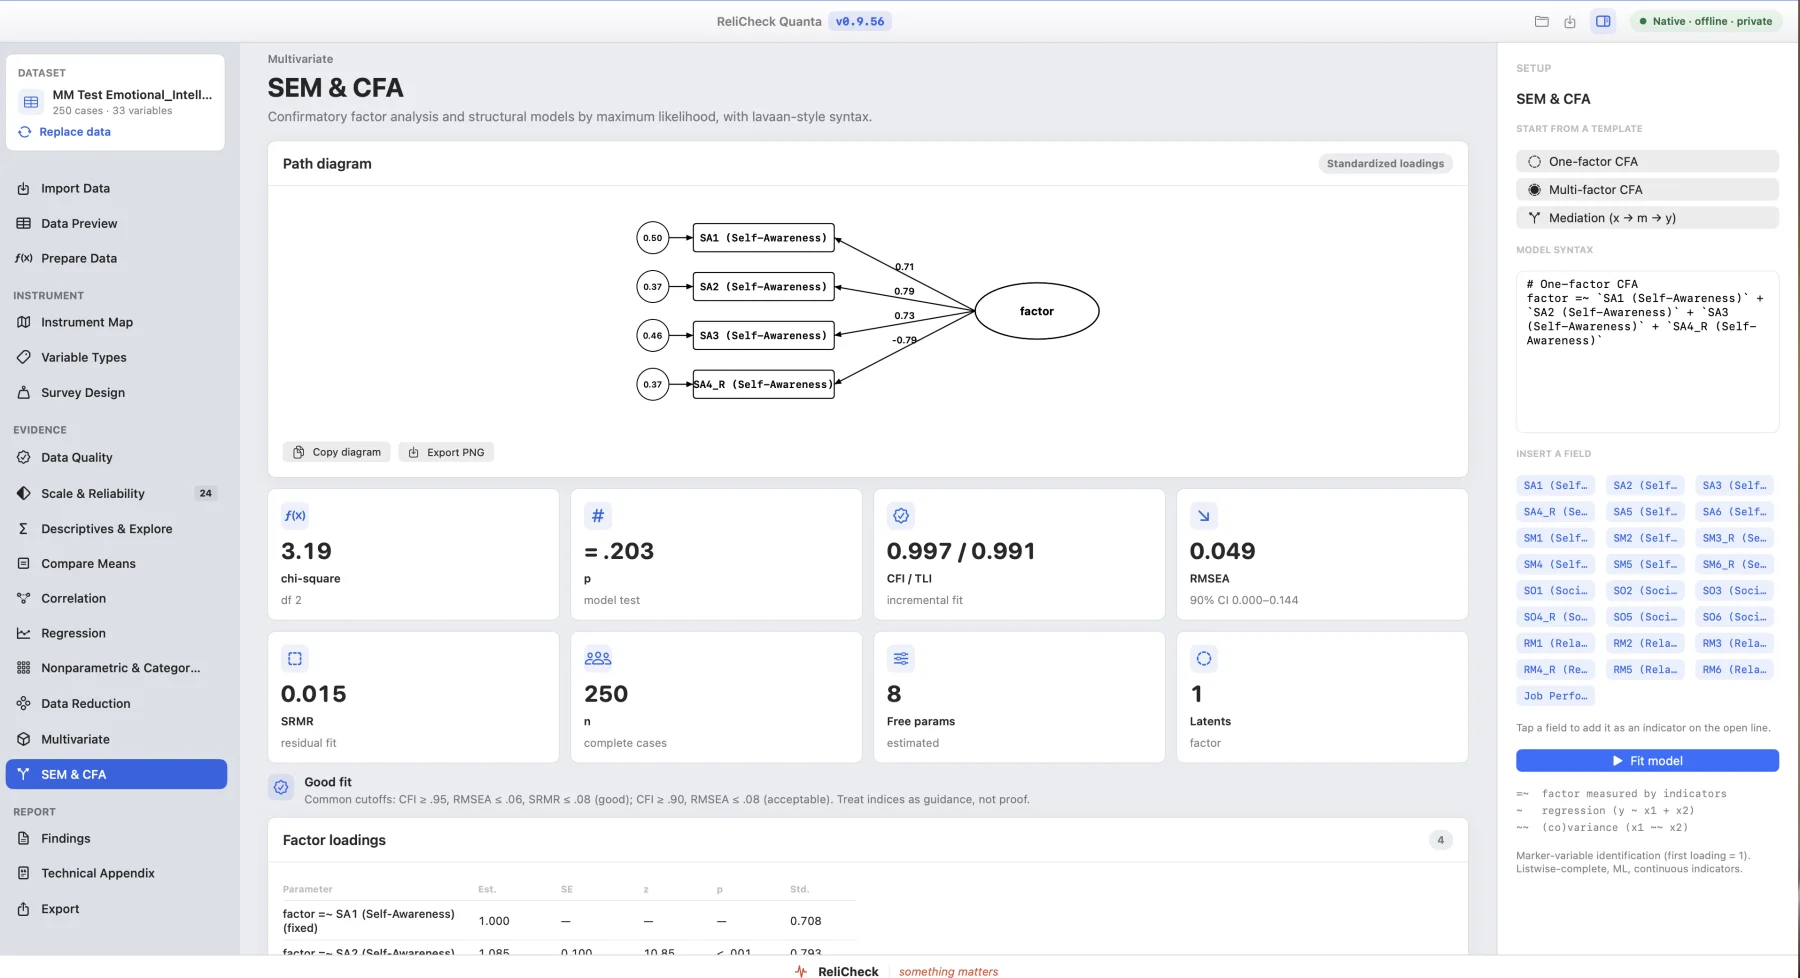
Confirmatory factor analysis, with the fit indices.
CFA and structural equation modelling with the fit statistics reviewers ask for, reported together rather than one at a time.
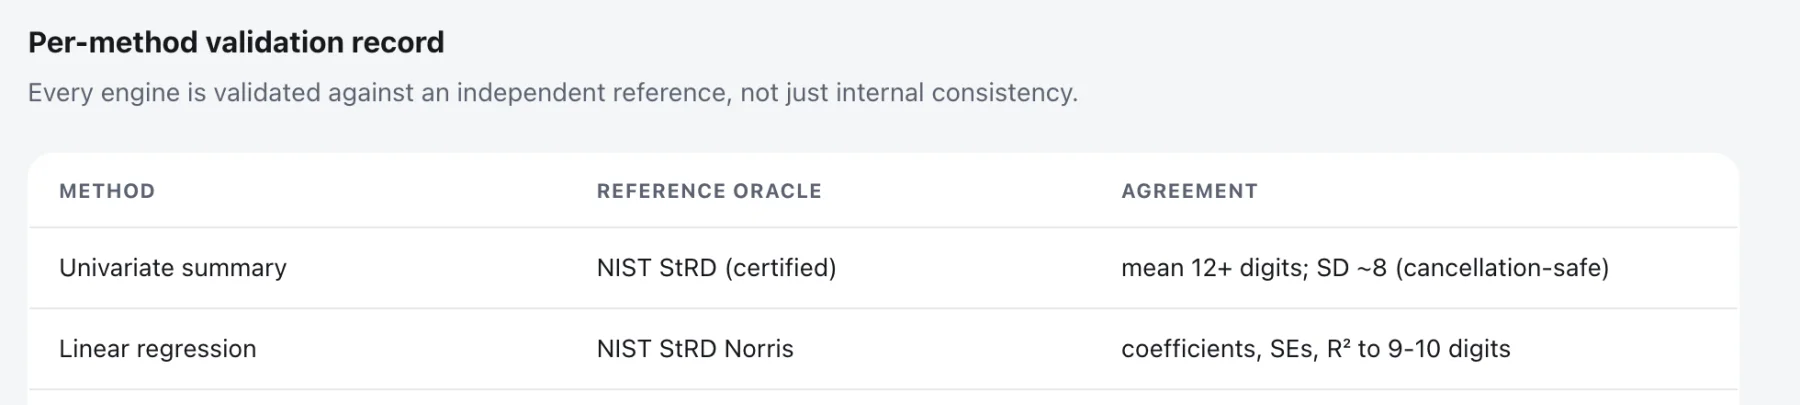
The validation record is published, method by method.
Every method lists the reference it was checked against and how far the agreement holds. Univariate summary and linear regression are validated against NIST reference datasets, to nine digits and beyond.
Read the validation record ›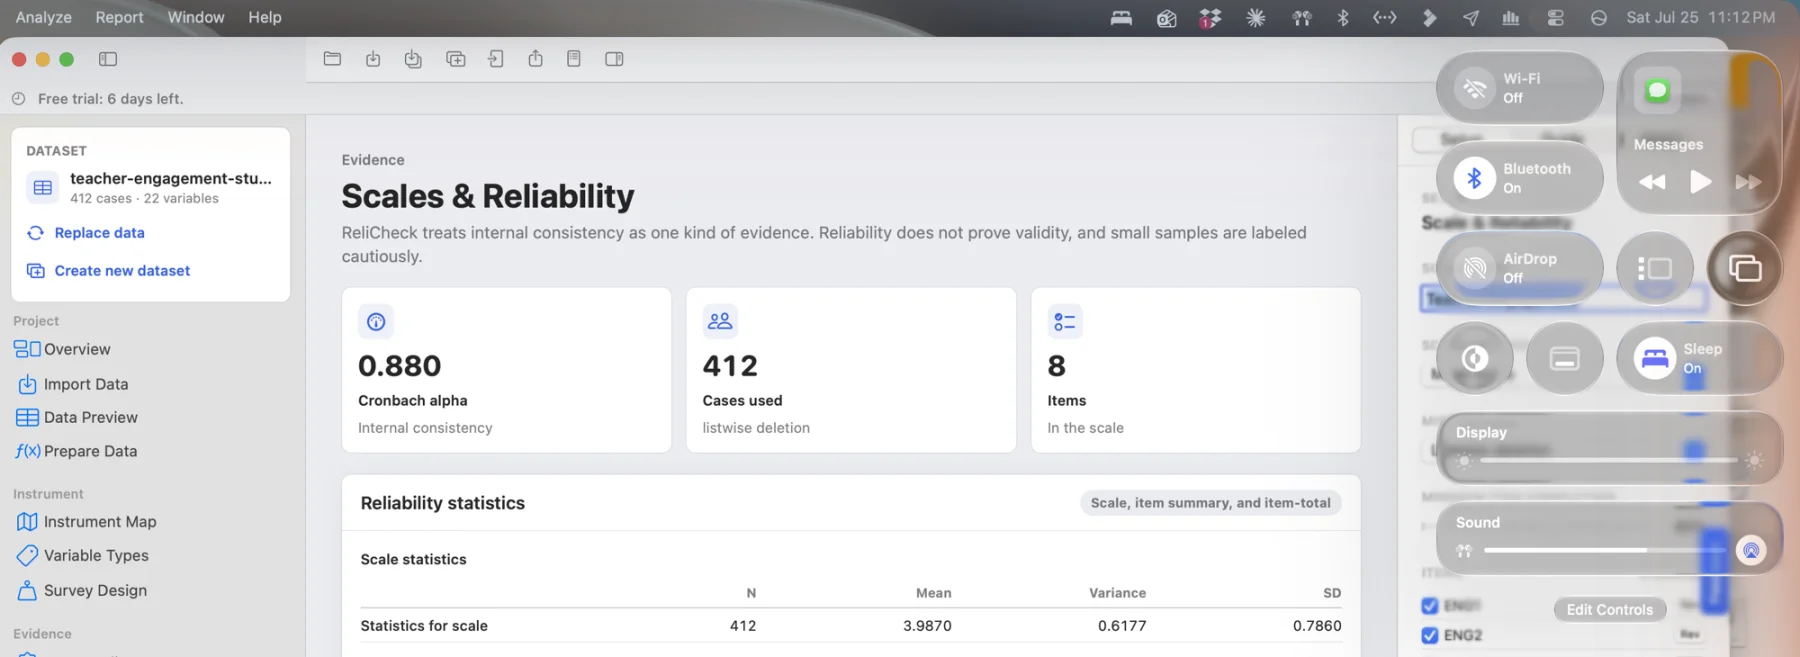
It tells you what a result cannot support.
Reliability is evidence, not proof of validity. A group difference is association, not causation. Quanta labels small samples cautiously and says so on the result, where it matters.
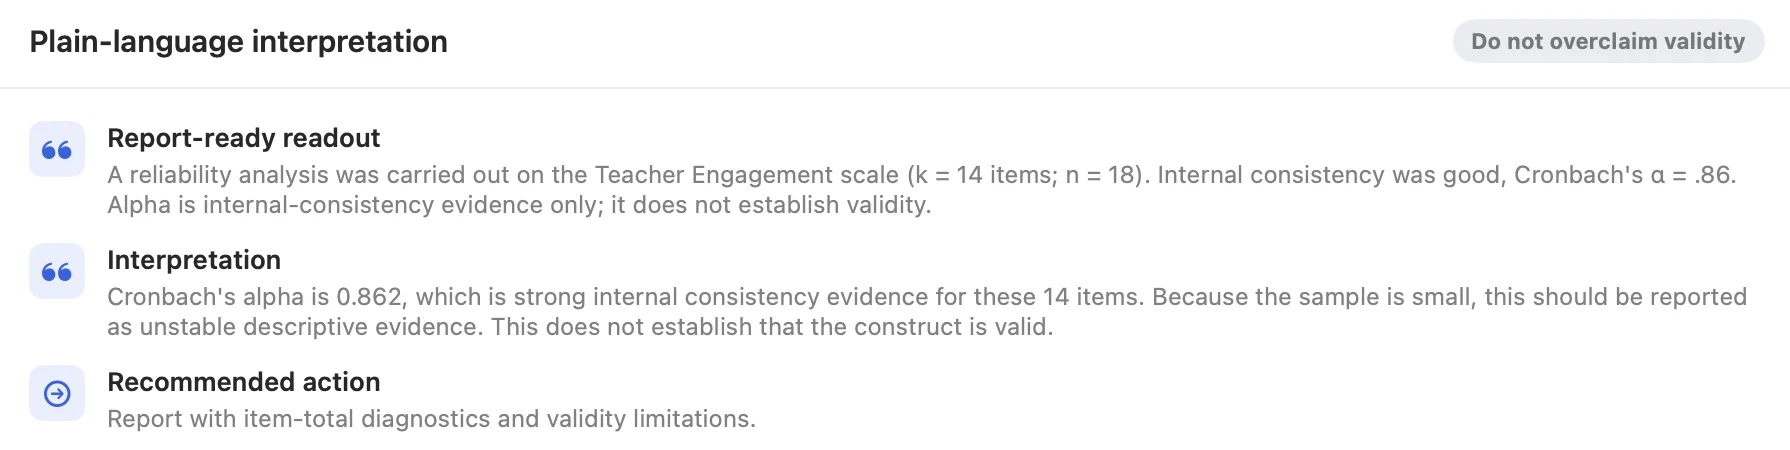
Careful by default.
The software will not overstate a finding to look impressive. If the evidence is thin, the output says the evidence is thin. That is the whole design position. The safeguards are contextual recommendations, never restrictions: Quanta surfaces the analyses that fit your design and flags mismatches, and every test stays available to run.

It asks who your data represents. Before you analyze it.
A mean is only as honest as the sample behind it. Quanta's representation checks make that visible where statistical software never has.
What are representation checks? They show who your results actually describe, before you analyze anything. Missingness by group flags any question where one group skipped far more often than another, ten percentage points or more. Sample vs population compares your sample with population percentages you supply, category by category, and says plainly whether it is a match or a representation gap. Grouped descriptives flag small groups instead of folding them away. The checks live in Data Quality, in the base app. How representation checks work
Every finding starts from an answer to the question most analyses skip: who is actually in this data, and who is missing from it. In the base app, for everyone.
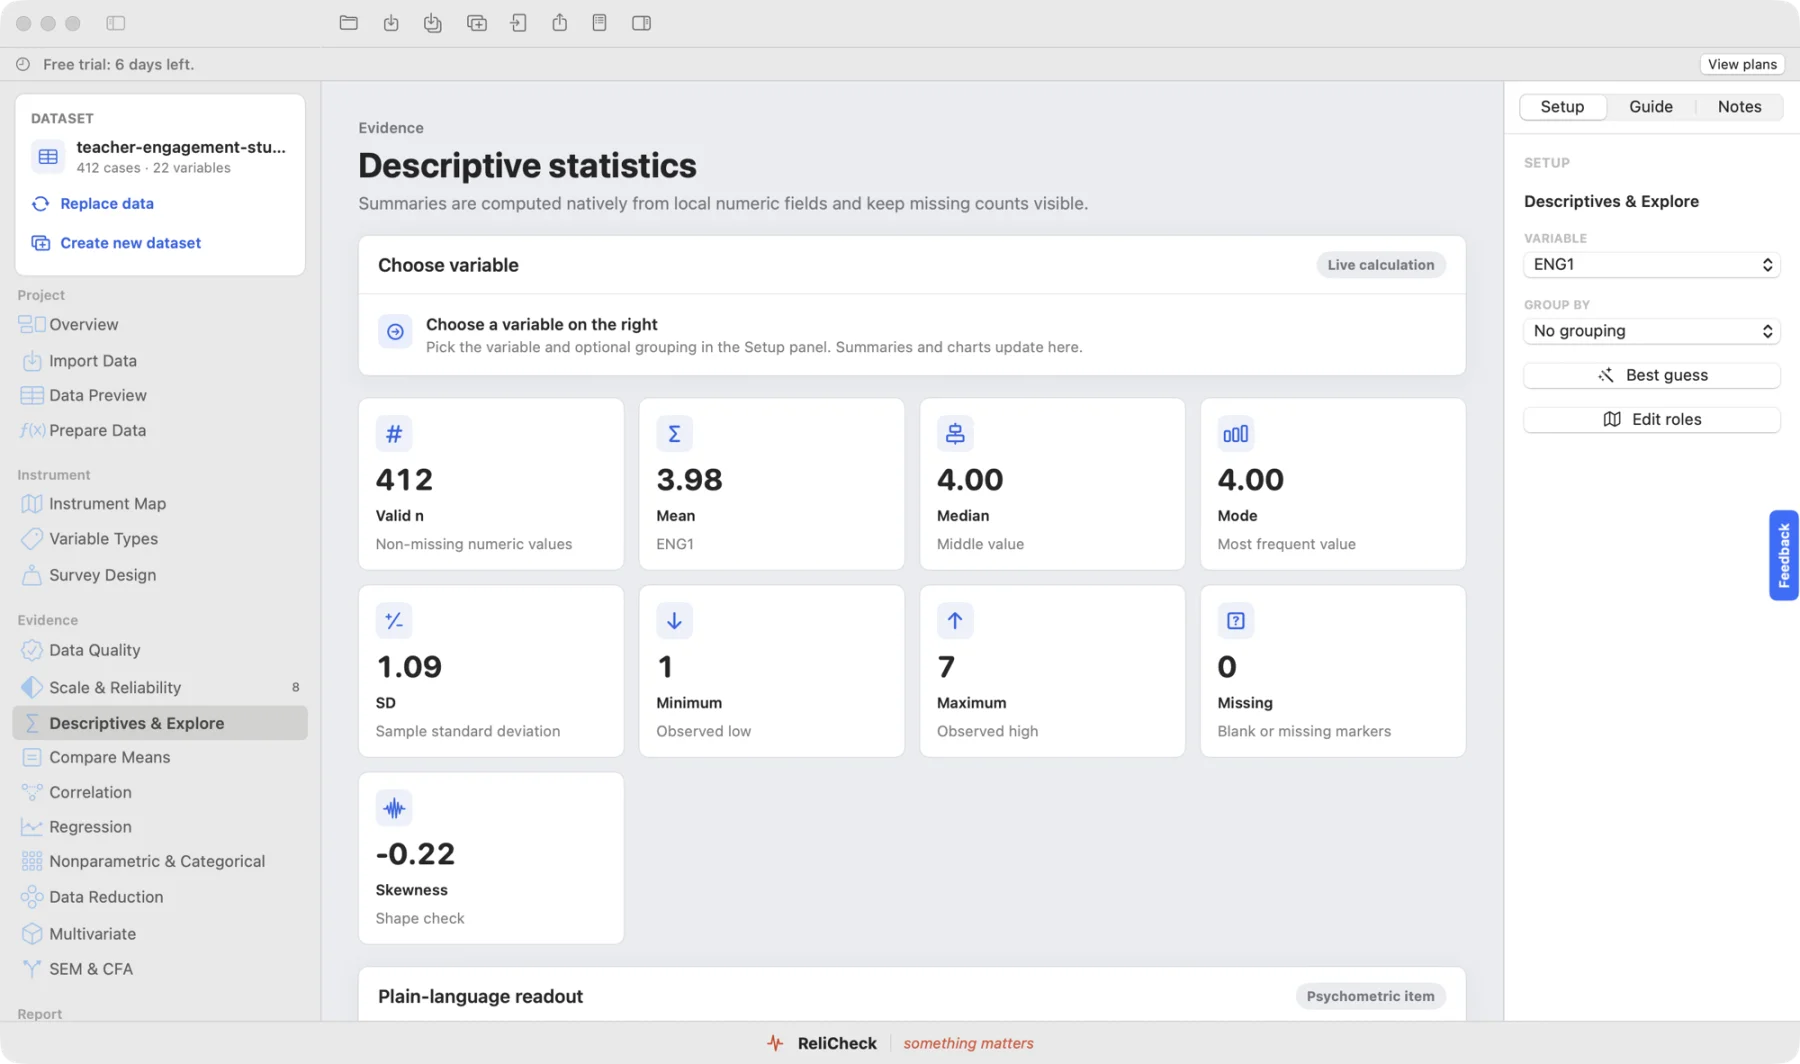
Setup on the right. Results in the centre.
The layout stays put as you move between analyses, so the thing you are reading is always in the same place and the thing you are changing is always in the same place.
Every method, explained.
Step-by-step pages for the analyses graduate students, faculty, and research teams run most: what each one answers, how to run it in Quanta, how to read the result, and how to report it in APA 7.
Resources
Common questions
How to cite Quanta
If Quanta contributed to a published analysis, please cite it in your methods section. Cite the version you actually used; the version is shown in the app under the About window.